
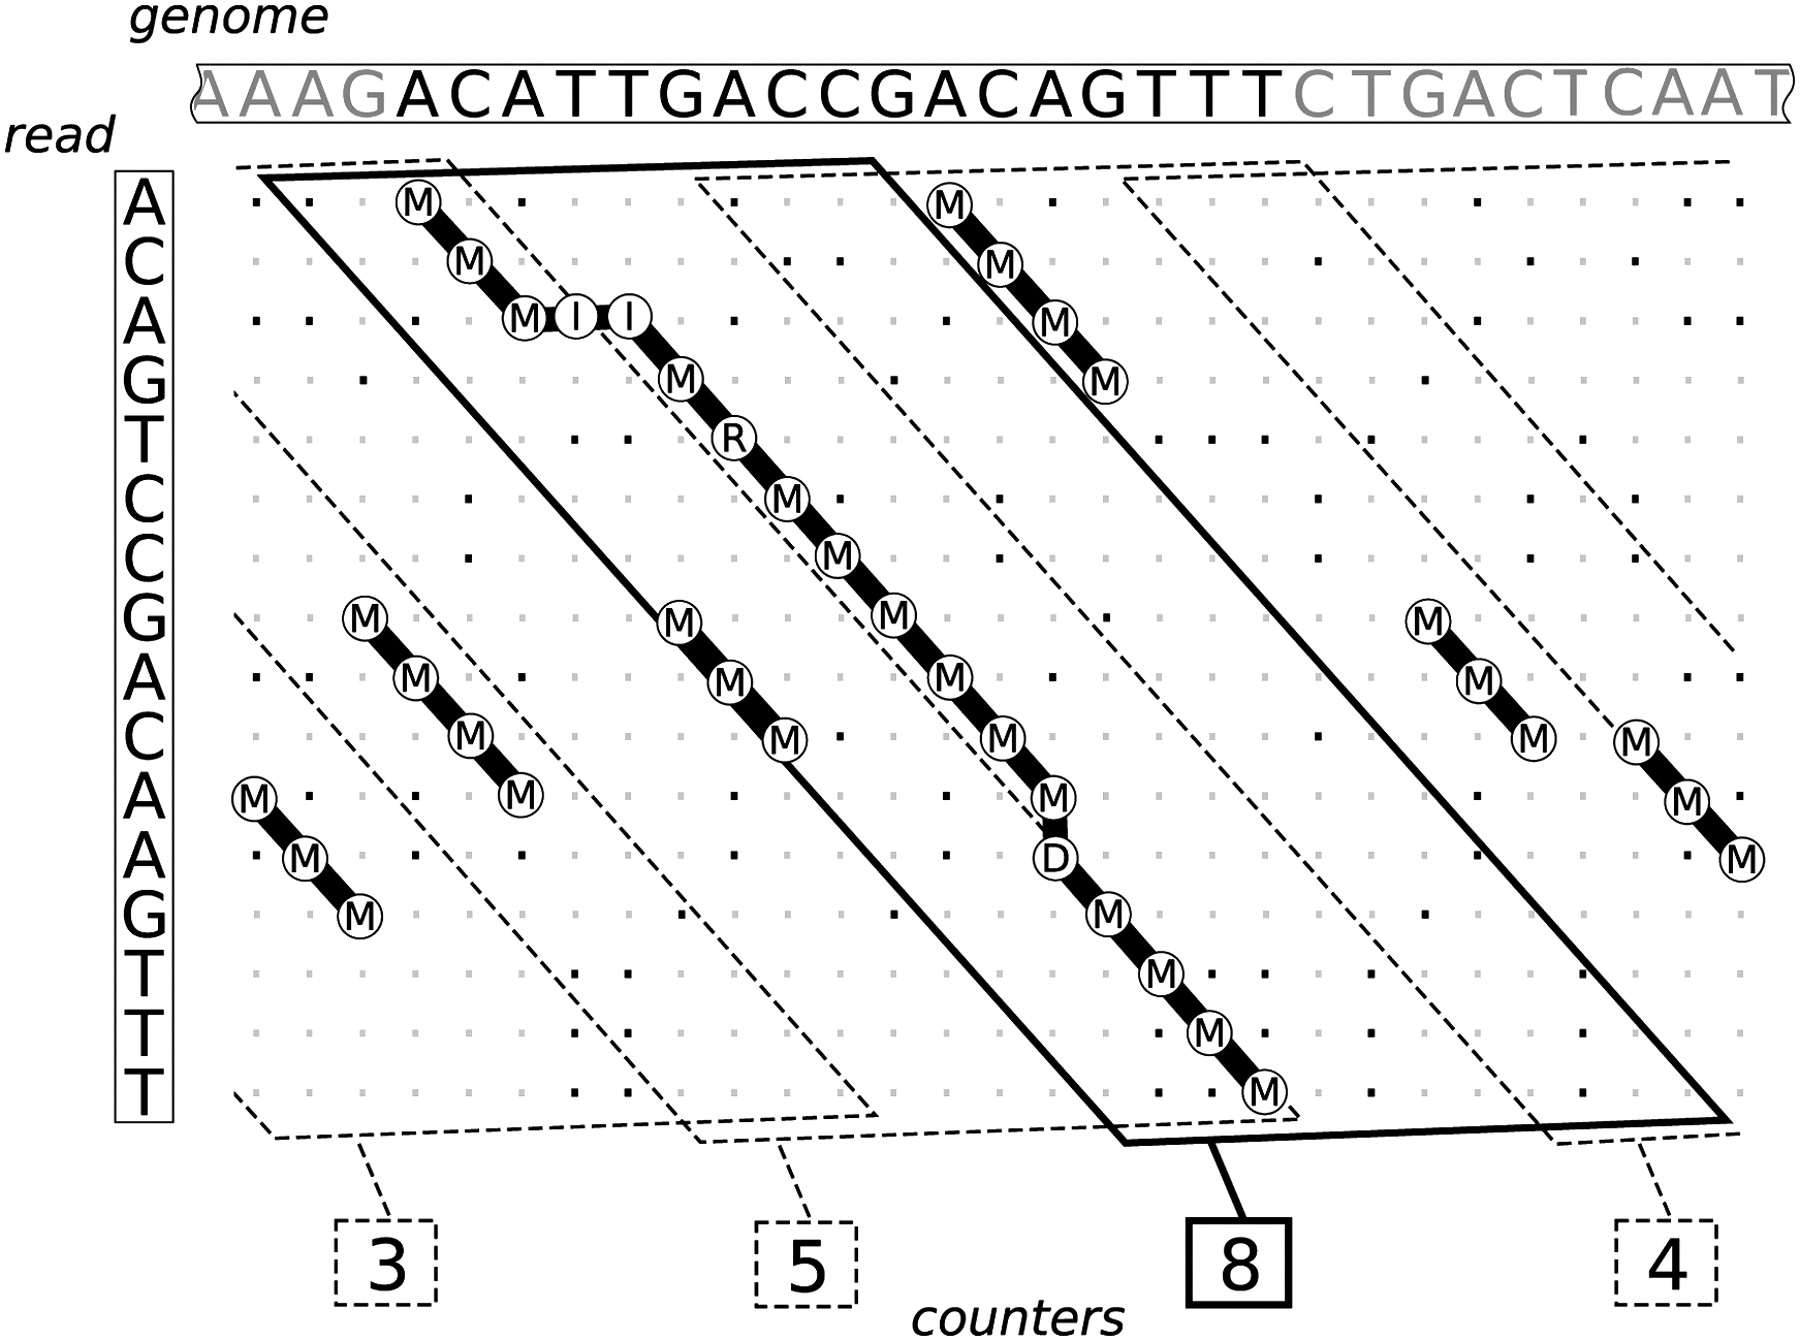
Figure 2.
The dot plot between a read and a genome is covered by parallelograms that span w = 12 diagonals and overlap by k = 4 diagonals. Common 3-gram are counted for each parallelogram. The marked parallelogram contains the complete transcript, therefore it counts all 3-gram that correspond to the seven three-matches in the transcript.


