
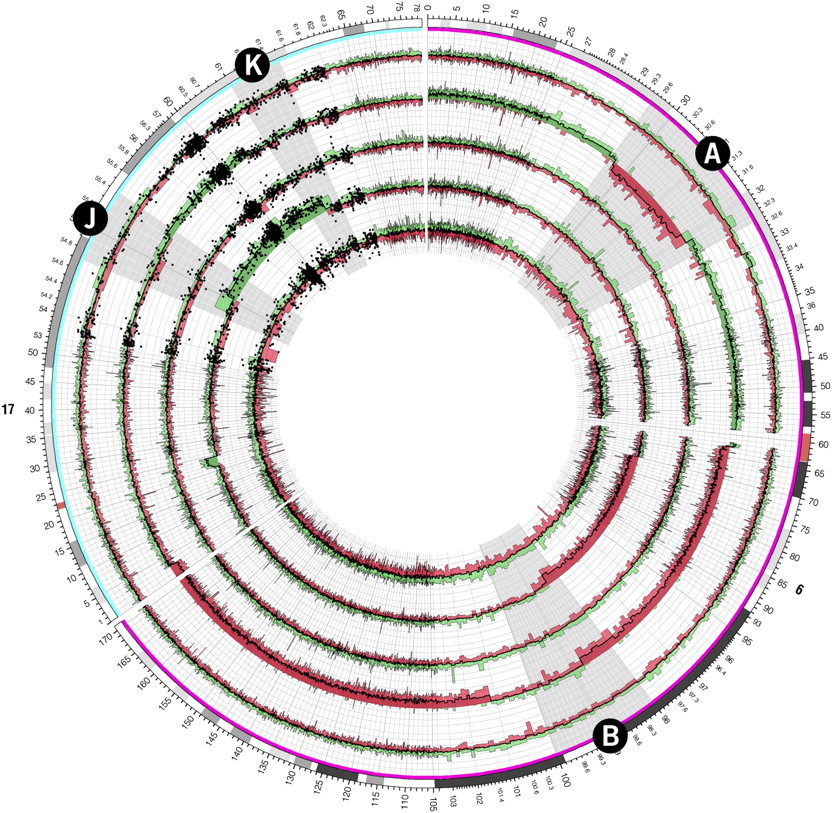
Figure 7.
Copy number profiles for chromosomes 6 and 17 of five follicular lymphoma tumor samples generated from the Affymetrix Mapping 500K array. Regions of interest A and B on chromosomes 6 and J and K on chromosomes 17 (corresponding to similarly labeled zoomed ideograms in Fig. 6) are magnified by a continuous scale expansion in these regions. Individual probe values are shown as a scatterplot in the vicinity of regions J and K.


