
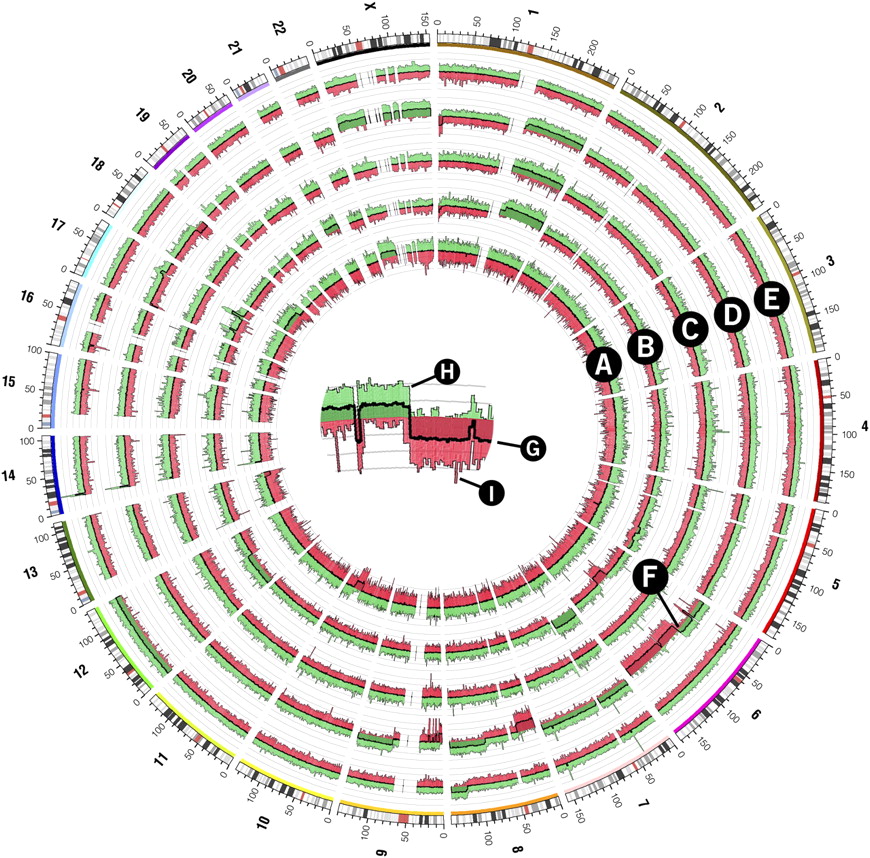
Copy number whole-genome profiles of five follicular lymphoma tumor samples generated from the Affymetrix Mapping 500K array. Samples are represented in each of the five histograms in tracks A–E. A crop of histogram region F is shown in the center of the figure to demonstrate the structure of each histogram track. The central thick line (G) represents the average probe value across 250 adjacent probes. The area between this line and y = 0 is filled with green or red depending on whether the average value is positive (i.e., increased copy number value) or negative (decreased copy number value), respectively. Variability within each 250-probe set is shown in histogram components H and I, which show the maximum and minimum of three-probe average values within the set, respectively. The area under the maximum and minimum traces is filled with a lighter green or red, respectively.


