
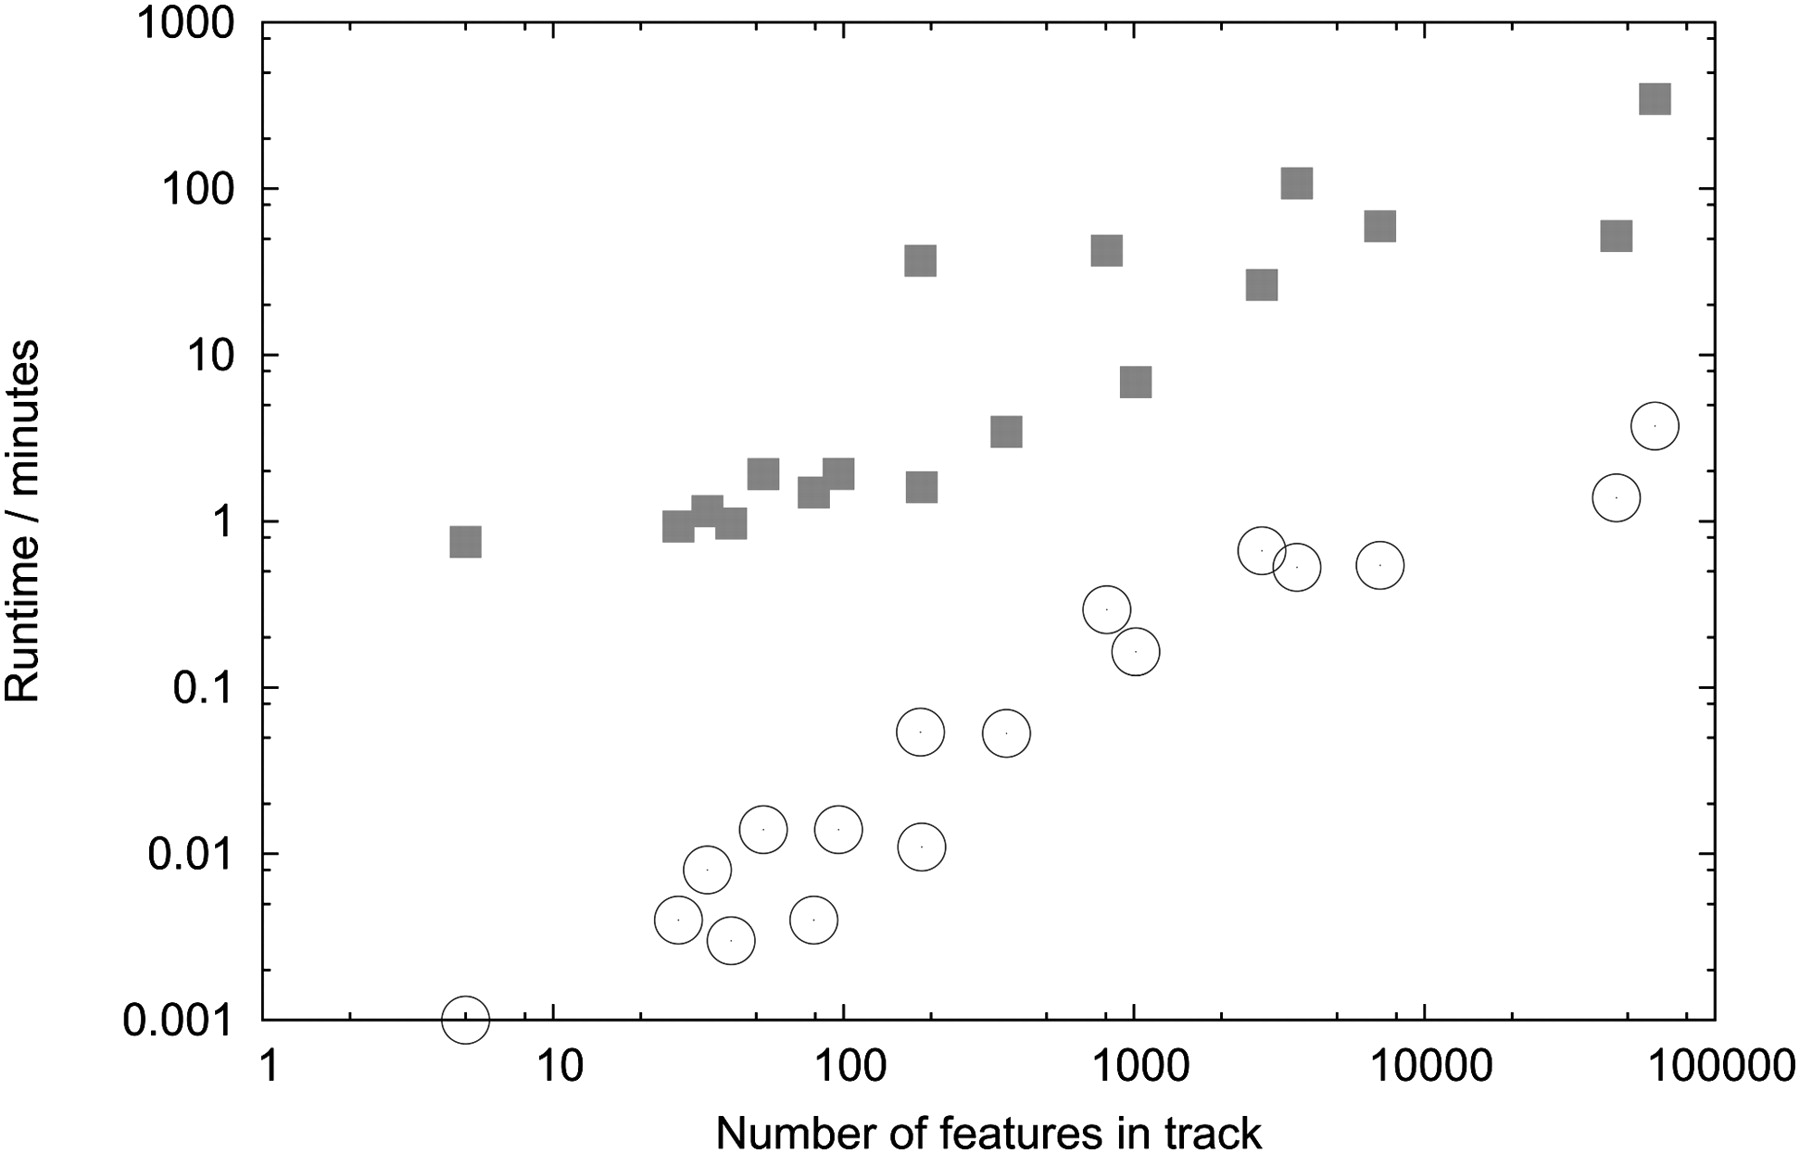
Figure 4.
Time to generate tracks: TiledImage vs. JBrowse. Time required to generate each D. melanogaster feature annotation track, plotted as a function of the number of features in the track, for both server-side rendering (TiledImage, squares) and client-side rendering (JBrowse, circles). See Table 2 for raw data. See Results section for description of data, hardware, and software used in this benchmark.


