
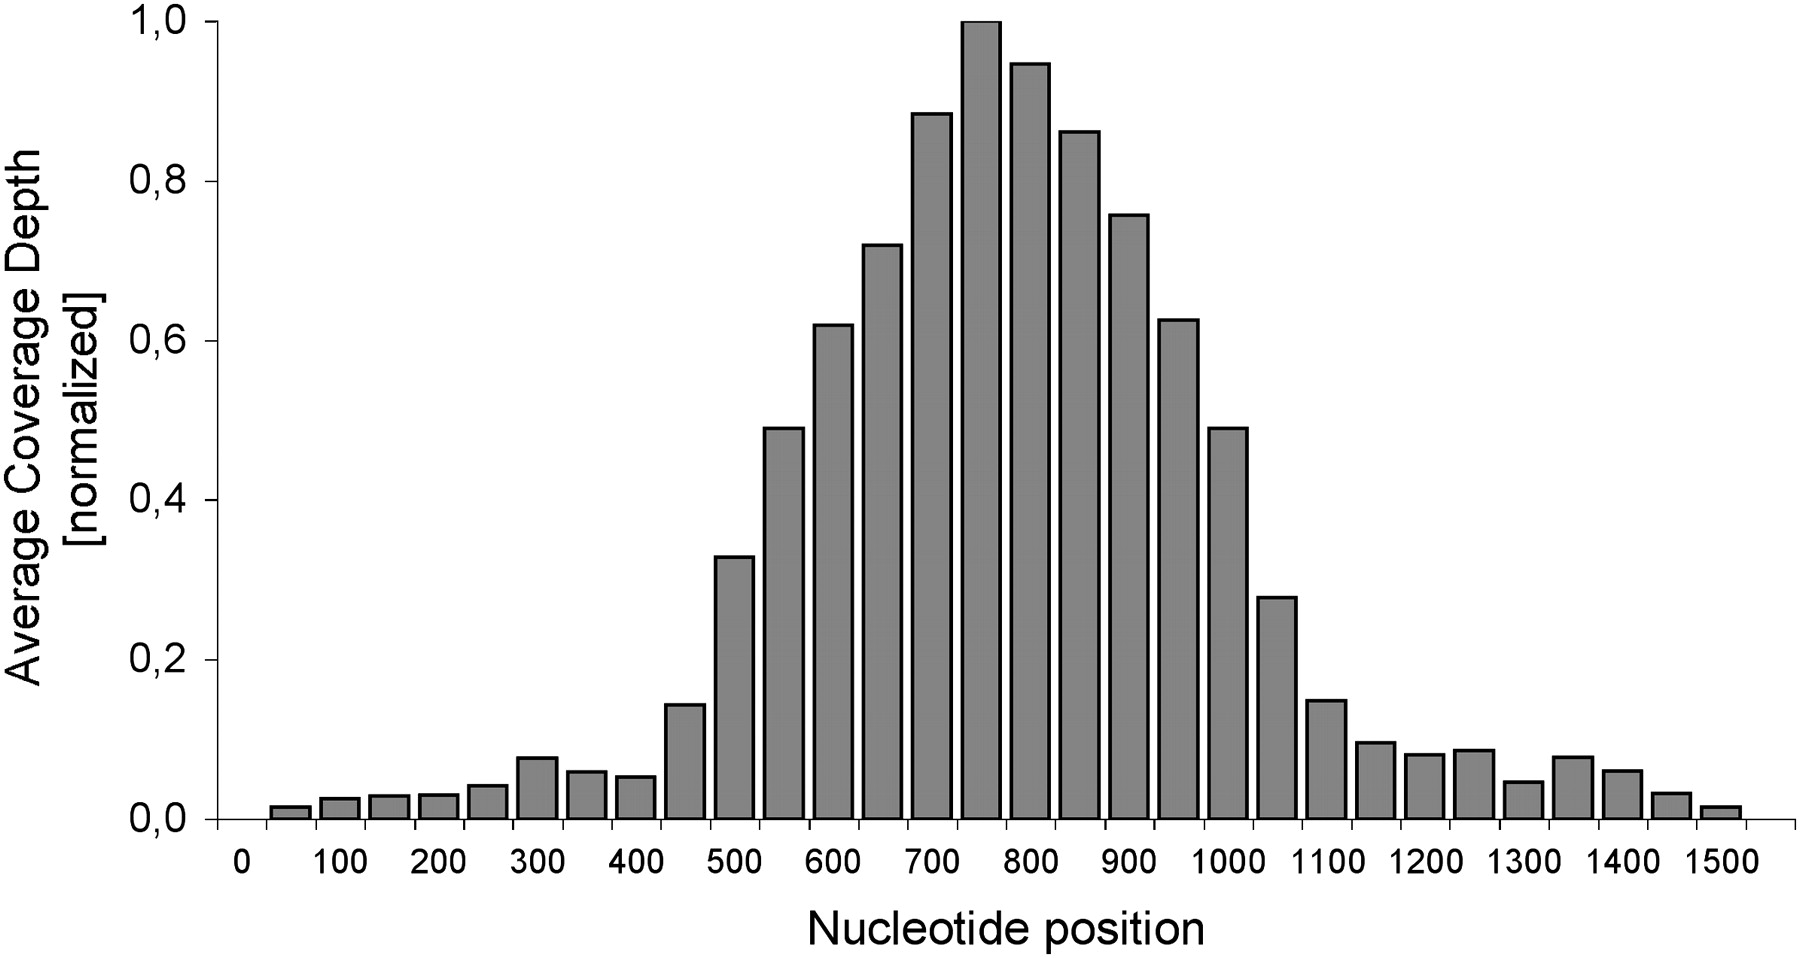
Figure 3.
Average spatial distribution of coverage depths for ROI of 1000 human 500-bp dbSNP loci obtained from mapping analysis after sequence enrichment from a human genomic DNA sample and Illumina GAII sequencing. The x-axis shows the nucleotide positions of the ROI, consisting of the core region covered by capture probes for array-based sequence enrichment (HR, nucleotide positions 501–1000) with flanking regions of ±500 nucleotides. The y-axis shows the coverage depth for all 1000 loci of sample NA18561 averaged for each 50-bp segment and normalized to the maximal depth of coverage.


