
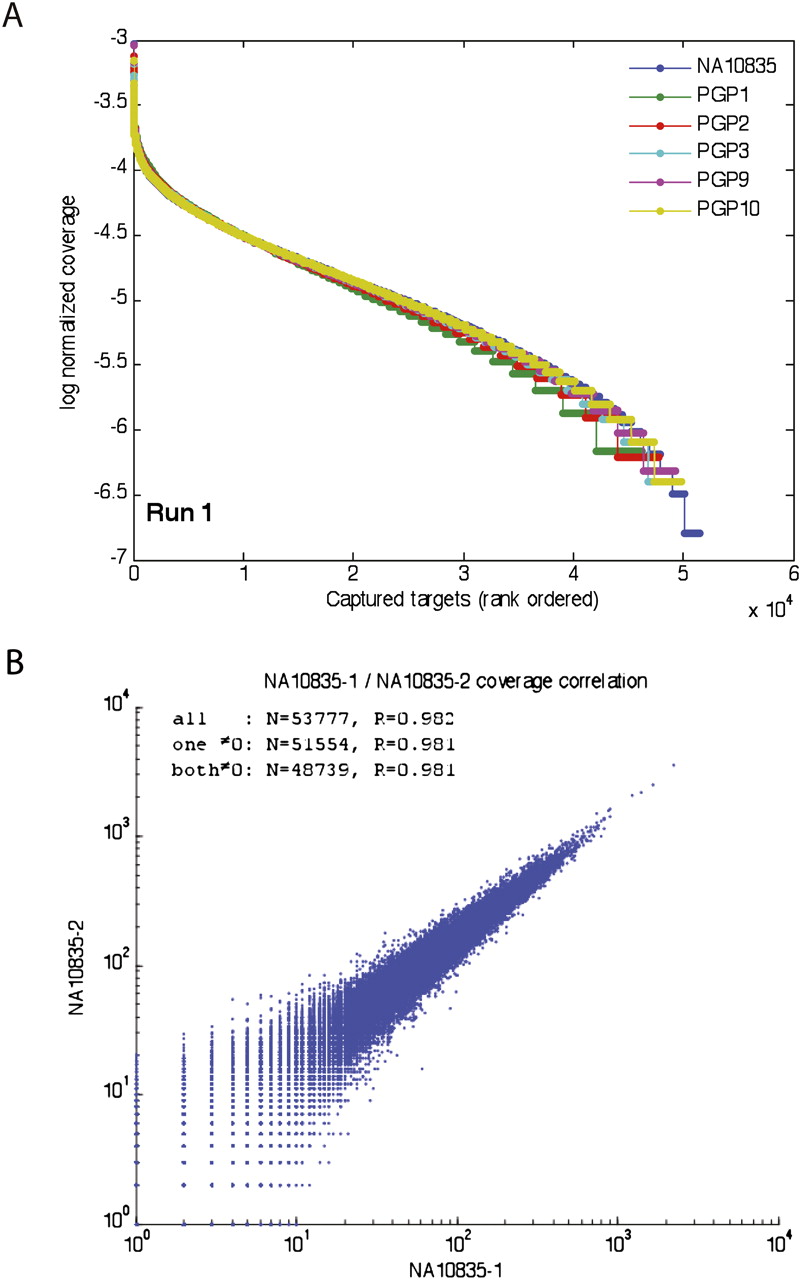
Improved performance of padlock technology. (A) Uniformity of target sites. For each sample, log-normalized coverage levels from sequencing of padlock probe reaction products were computed for each captured target as the log10 of the number of target-mapped, filtered reads divided by the total number of mapped, filtered reads from the reaction. Targets were then ranked for each sample from highest to lowest numbers of mapped, filtered reads and plotted. Except at the extremes, curves exhibit a gradually decreasing slope, indicating that a large number of targets have coverage levels within two orders of magnitude. The plot above depicts sequencing run 1; sequencing run 2 is very similar (Supplemental Fig. 4). For both sequencing runs, overall samples, 54.4%–56.5% of all captured targets had coverage levels within a 10-fold range, and 87.2%–92.7% had coverage within a 100-fold range. (B) Reproducibility of padlock capture. Scatter plot of read coverage of the technical replicate libraries sequenced for NA10835. Pearson correlation coefficients (R) between read counts are provided for all 53,777 target sites (all), all target sites for which one of the replicates has nonzero coverage (one ≠0), and all for which both replicates have nonzero coverage (both ≠0). All Pearson correlation coefficients are >98.1%. The scatter plot is presented on a log–log scale and therefore only contains points corresponding to targets in the “both ≠0” set. The plot above depicts sequencing run 1; sequencing run 2 is very similar (Supplemental Fig. 6). For details on sequencing runs and read mapping and filtering, see text and Supplemental Text.


