
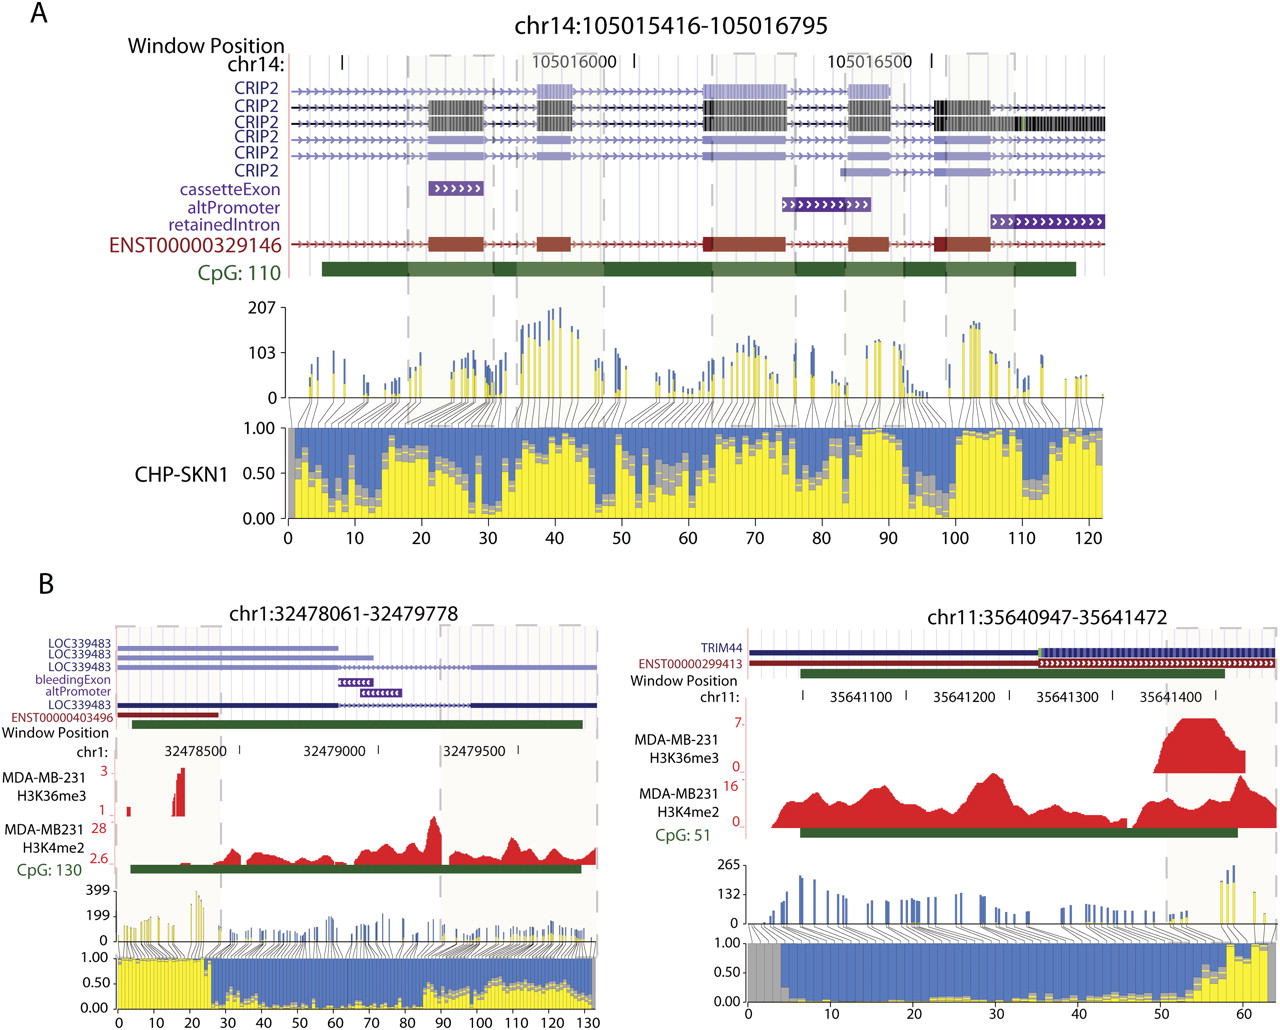
Blocks of DNA methylation overlap exons, histone H3K36me3, and histone H3K4me2 marks. (A) An example of a CGI that overlaps multiple exons. Annotated gene tracks were downloaded from the UCSC Genome Browser. The gene tracks are displayed above a histogram plotting methylation frequencies at specific CpG sites positioned along the region shown. Absolute read counts and actual distance between CpG sites are depicted in the upper histogram, whereas the lower histogram shows the proportion of methylated and unmethylated Cs at each site. Boxes with dashed borders highlight blocks of methylation overlapping exons. The edges of the block are defined by the point at which the proportion of reads methylated is at least 0.5. (B) Two examples for which the distribution of histone marks along the CGI reflects DNA methylation status. To display the ChIP-seq data, a wiggle track was created for each histone mark by counting reads mapped in five-base windows across the genome.


