
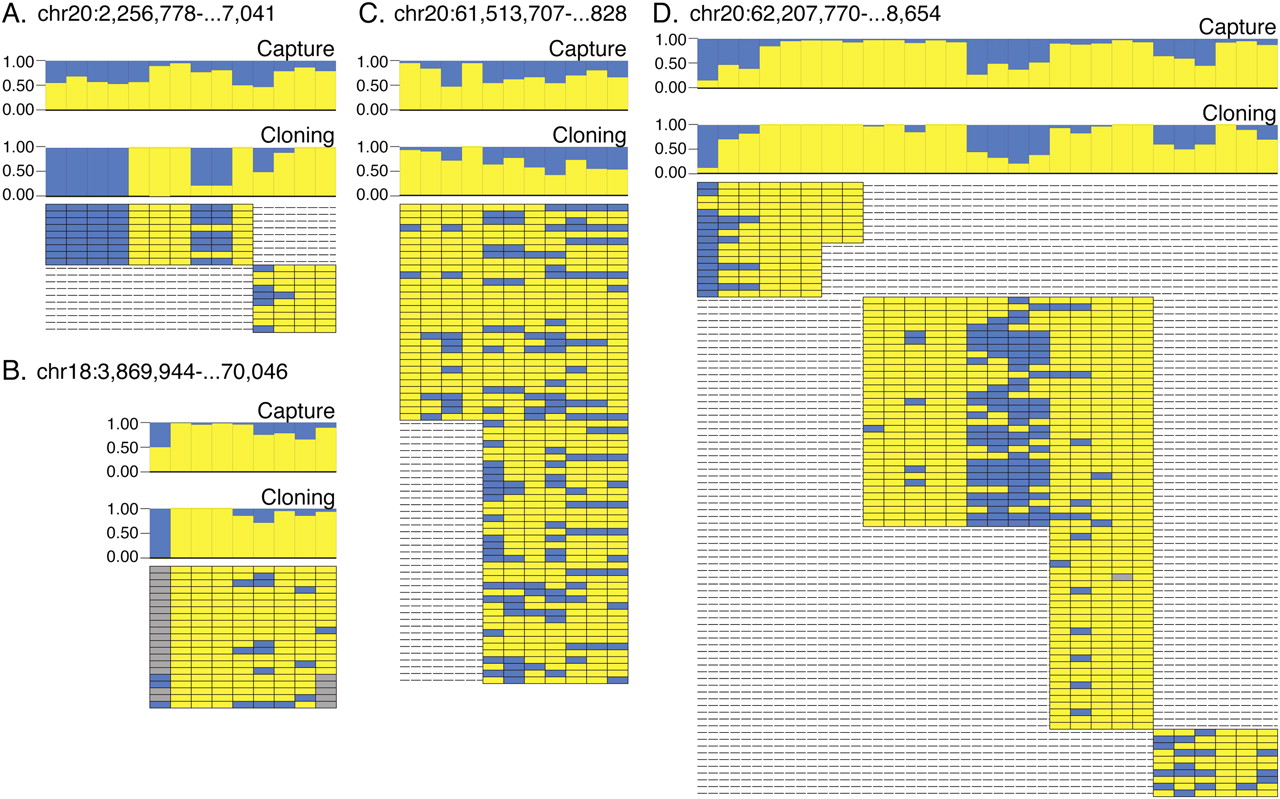
Figure 4.
Methylation status of bisulfite sequenced clones. (A–D) Four independent CGI loci are shown. Two histograms plot methylation frequencies at individual CpG sites for both the bisulfite capture data (upper) and the conventional bisulfite cloning data (lower) for all four loci. The block diagrams illustrate methylation state at each CpG site for each individually analyzed clone.


