
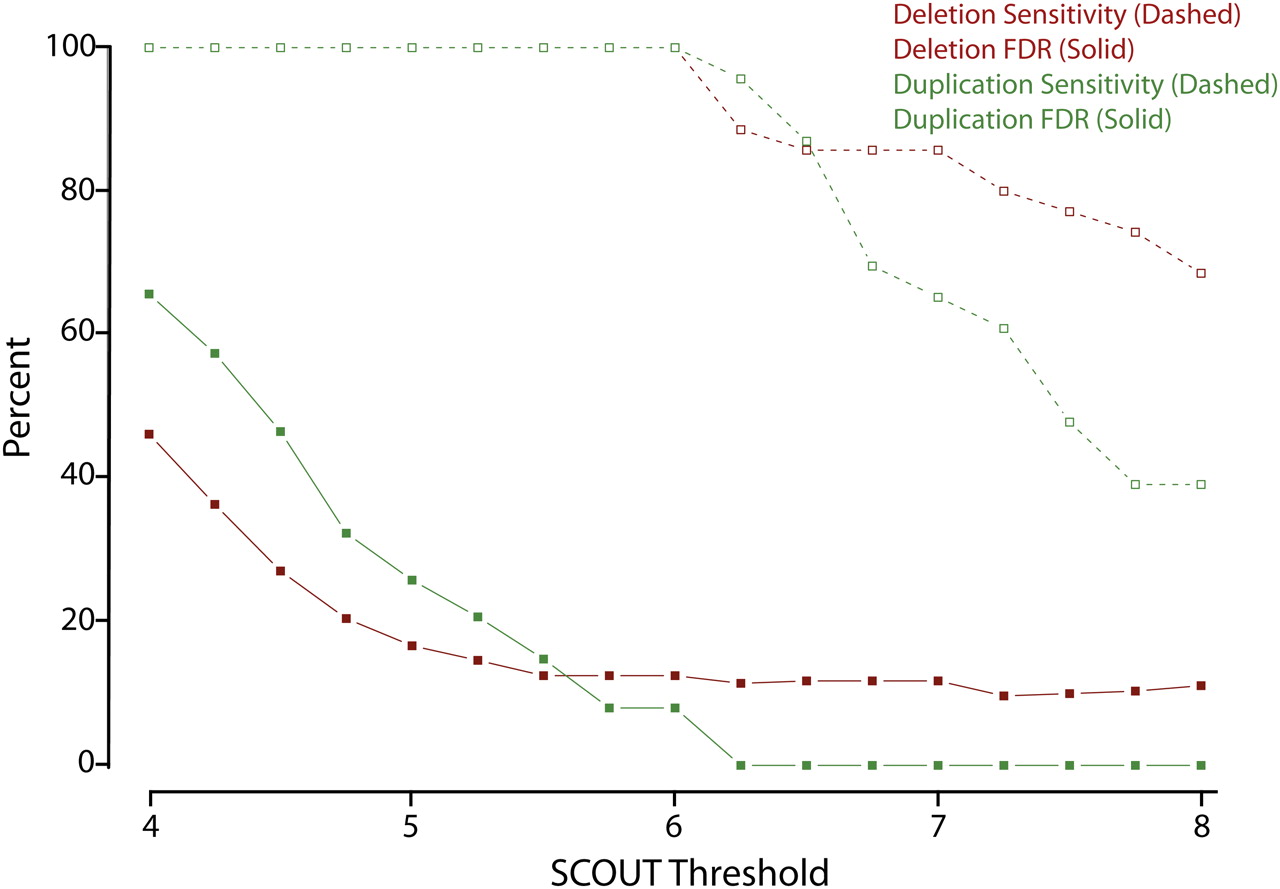
Figure 3.
Reliability of SCOUT predictions as a function of threshold. Sensitivity (dashed lines/open squares) and false discovery rates (FDR, solid lines/solid squares) to detect deletions (red) and duplications (green) are plotted as a function of the absolute value of the SCOUT threshold, incremented by units of 0.25. These estimates exclude regions covered by only two probes and also exclude CNVs in positive control samples.


