
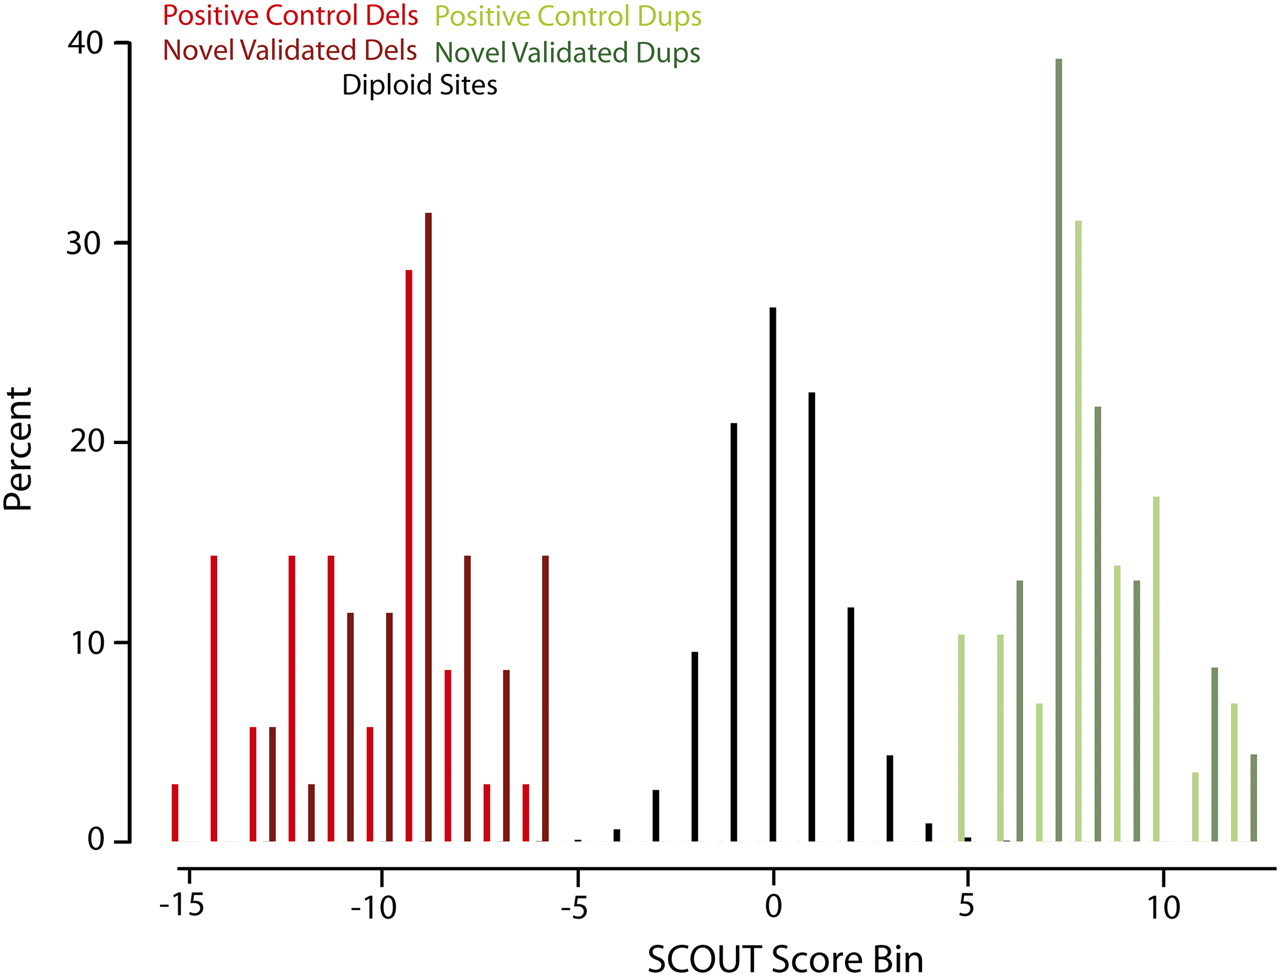
Figure 2.
SCOUT assigns highly negative scores to deletions (red), near-zero scores to diploid intervals (black), and highly positive scores to duplications (green). Normalized histograms (Y-axis indicates percent of each category) for known deletions (red, n = 35), predicted and validated deletions (dark red, n = 35), known duplications (green, n = 29), and predicted and validated duplications (dark green, n = 23) are shown. SCOUT scores are binned by 1-unit increments with the center of each bin labeled on the X-axis. The vast majority of scores correspond to diploid sites (n = 10,566 or 98.9%).


