
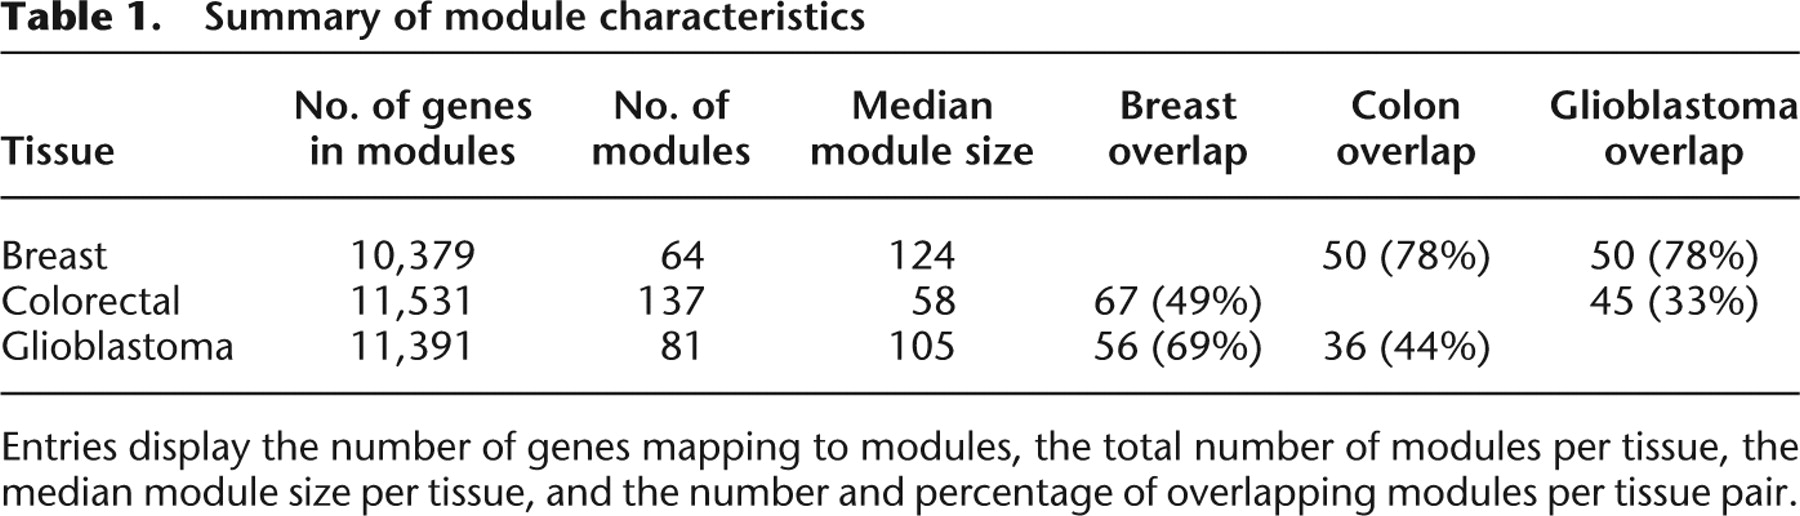
Table 1.
Summary of module characteristics
Click on table to view larger version.
-
Entries display the number of genes mapping to modules, the total number of modules per tissue, the median module size per tissue, and the number and percentage of overlapping modules per tissue pair.


