
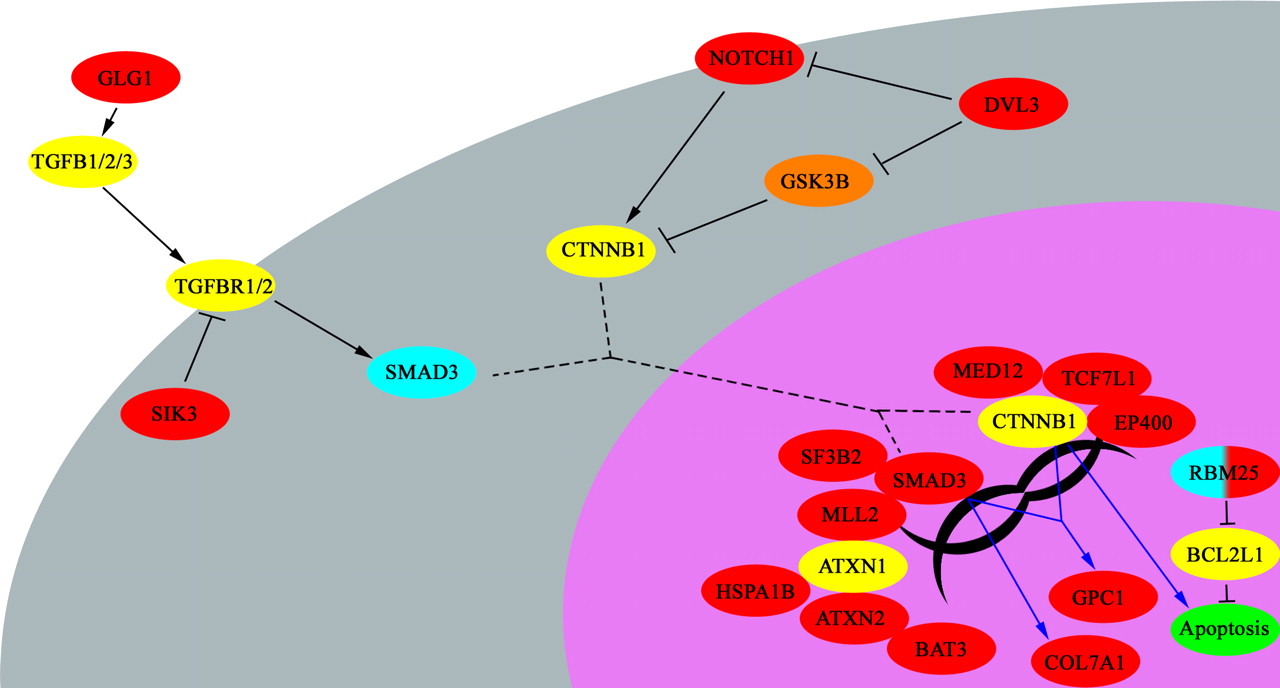
Figure 4.
The relationship of genes mutated in breast module 26. (Red ovals) Genes mutated in breast cancer module 26; (aqua ovals) breast module 26 genes mutated in colon cancer; (orange ovals) the closely related breast module 27 genes; (yellow ovals) genes not present in breast cancer module 26. (Black lines or touching ovals) Functional protein relationships; (blue lines) transcriptional relationships. Dotted lines depict movement of SMAD3 and beta-catenin (CTNNB1) from the cytoplasm to nucleus.


