
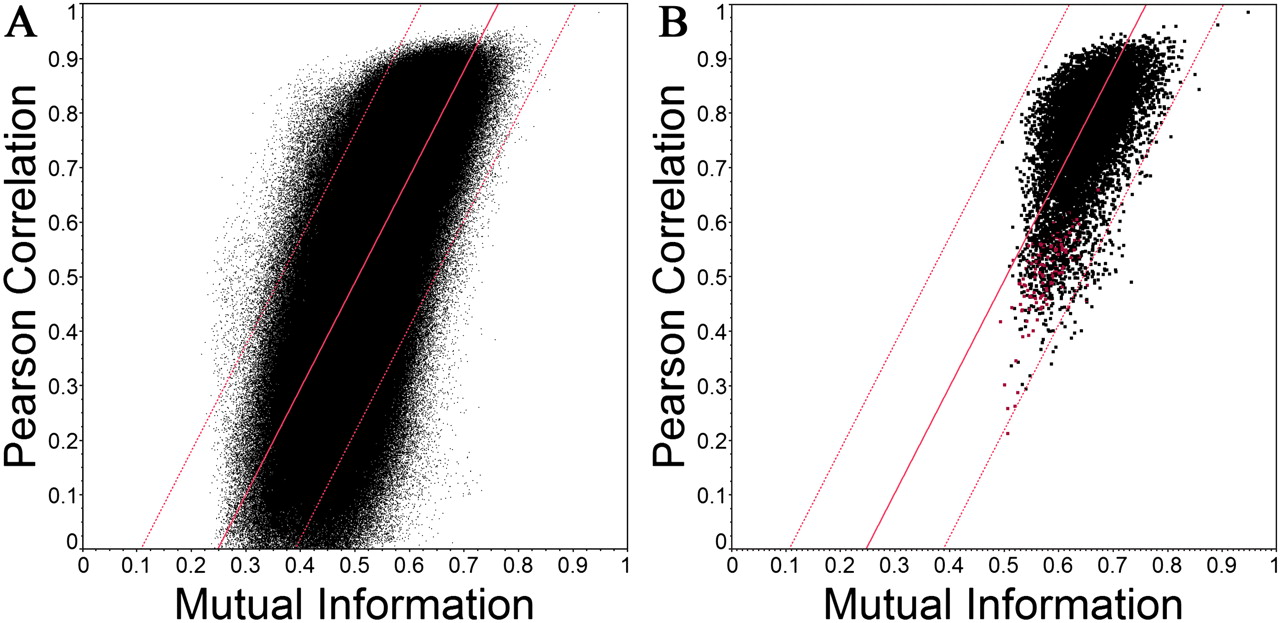
Figure 1.
Mutual information vs. Pearson correlation. (A) Scatterplot of mutual information scores vs. Pearson's correlation coefficients for genes in breast module 26 vs. all other genes. The two scores are strongly correlated R2 = 0.53. The central line is the linear fit with 95% confidence bands. (B) Scatterplot of mutual information scores vs. Pearson's correlation coefficients for genes in breast module 26 with only other genes in breast module 26. Scores involving TCF7L1 are highlighted in red. Linear fit and 95% band of A is overlaid to demonstrate bias for high mutual information scores vs. Pearson's correlation coefficients.


