
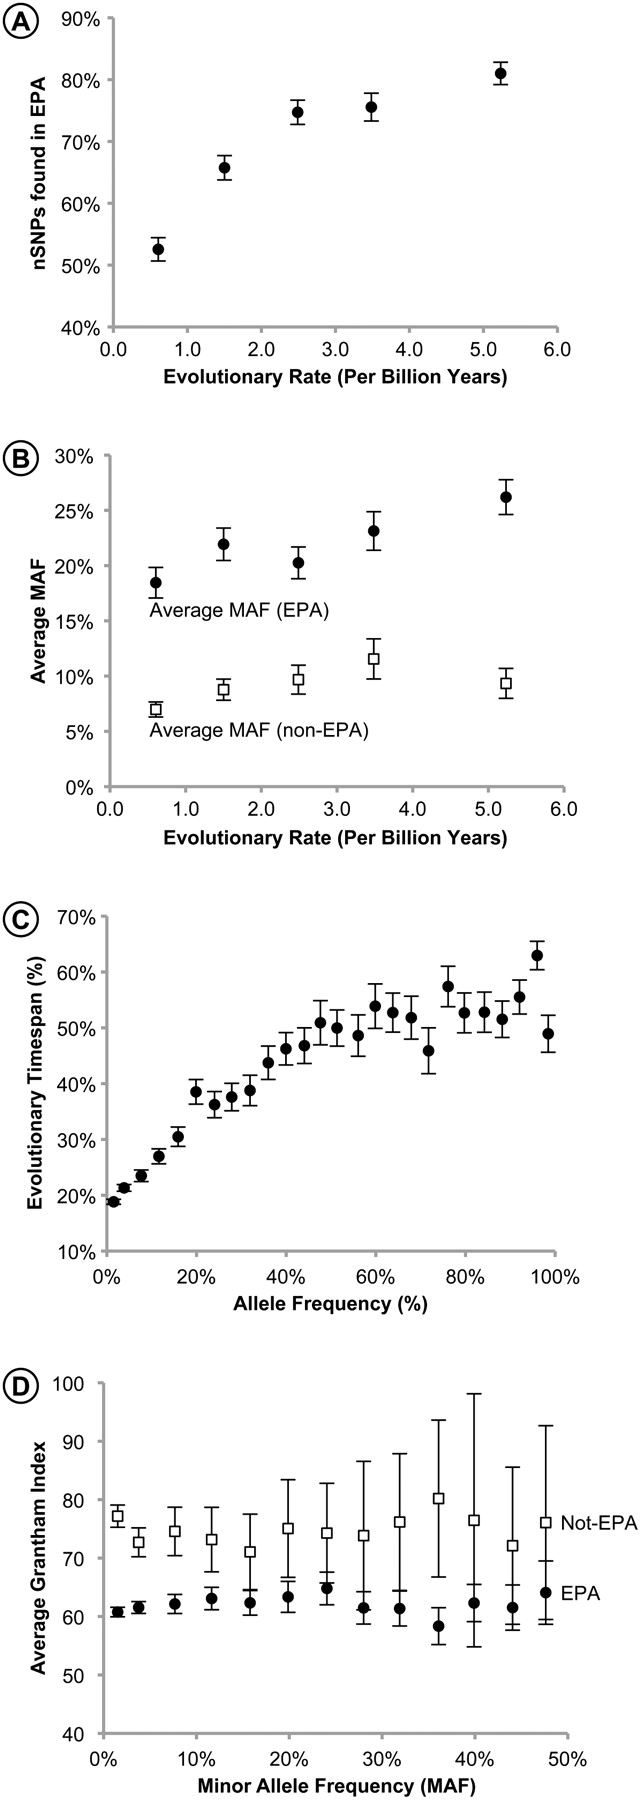
Analysis of EPAs. (A) The relation of the evolutionary rate with the proportion of nSNPs present in the set of EPAs in the variable sites (r = 0.91, P < 0.02). (B) The average allele frequencies of nSNPs present in EPAs (closed circles) and absent from the set of EPAs (open squares) in variable positions evolving with different rates. Mean allele frequencies are significantly different between two EPA categories for each rate class (P << 0.01). (C) Relationship between nSNPs frequency and the percentage of evolutionary time span (%ETS) of the corresponding EPA (r = 0.90, P << 0.01). All non-EPA nSNPs have an ETS of 0. (D) The biochemical severities of nSNPs present in EPAs (closed circles) and absent from EPAs (open squares). Error bars, 95% confidence intervals derived from the SEMs.


