
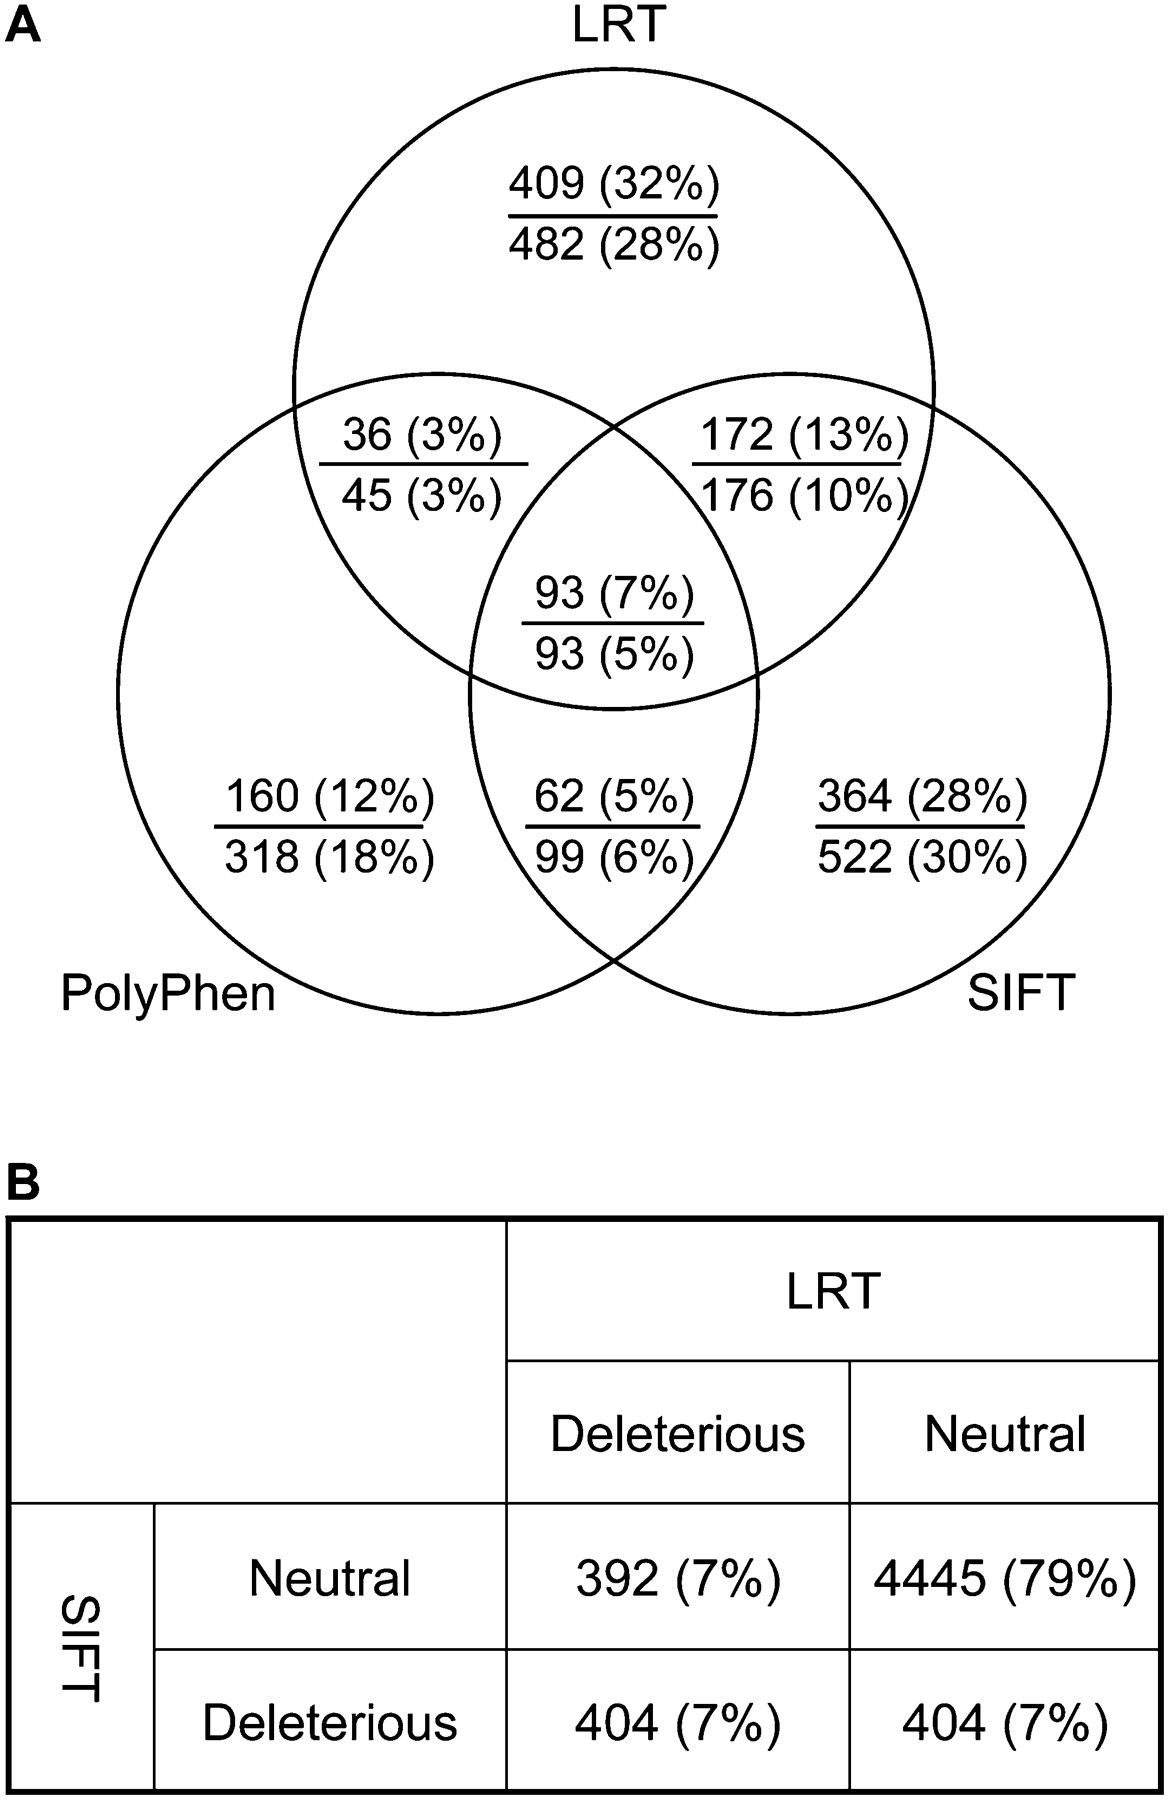
Figure 3.
Comparison of SIFT, PolyPhen, and the likelihood ratio test (LRT) predictions. (A) Venn diagram of the number of predictions made by the three methods. Probably damaging mutations were used for PolyPhen. Numbers below and above each line are for the complete set of 7534 high-quality variants present within the Venter genome and a subset of 4303 where all three methods generated a prediction, respectively. (B) Overlap between the LRT and SIFT predictions based on the same alignments.


