
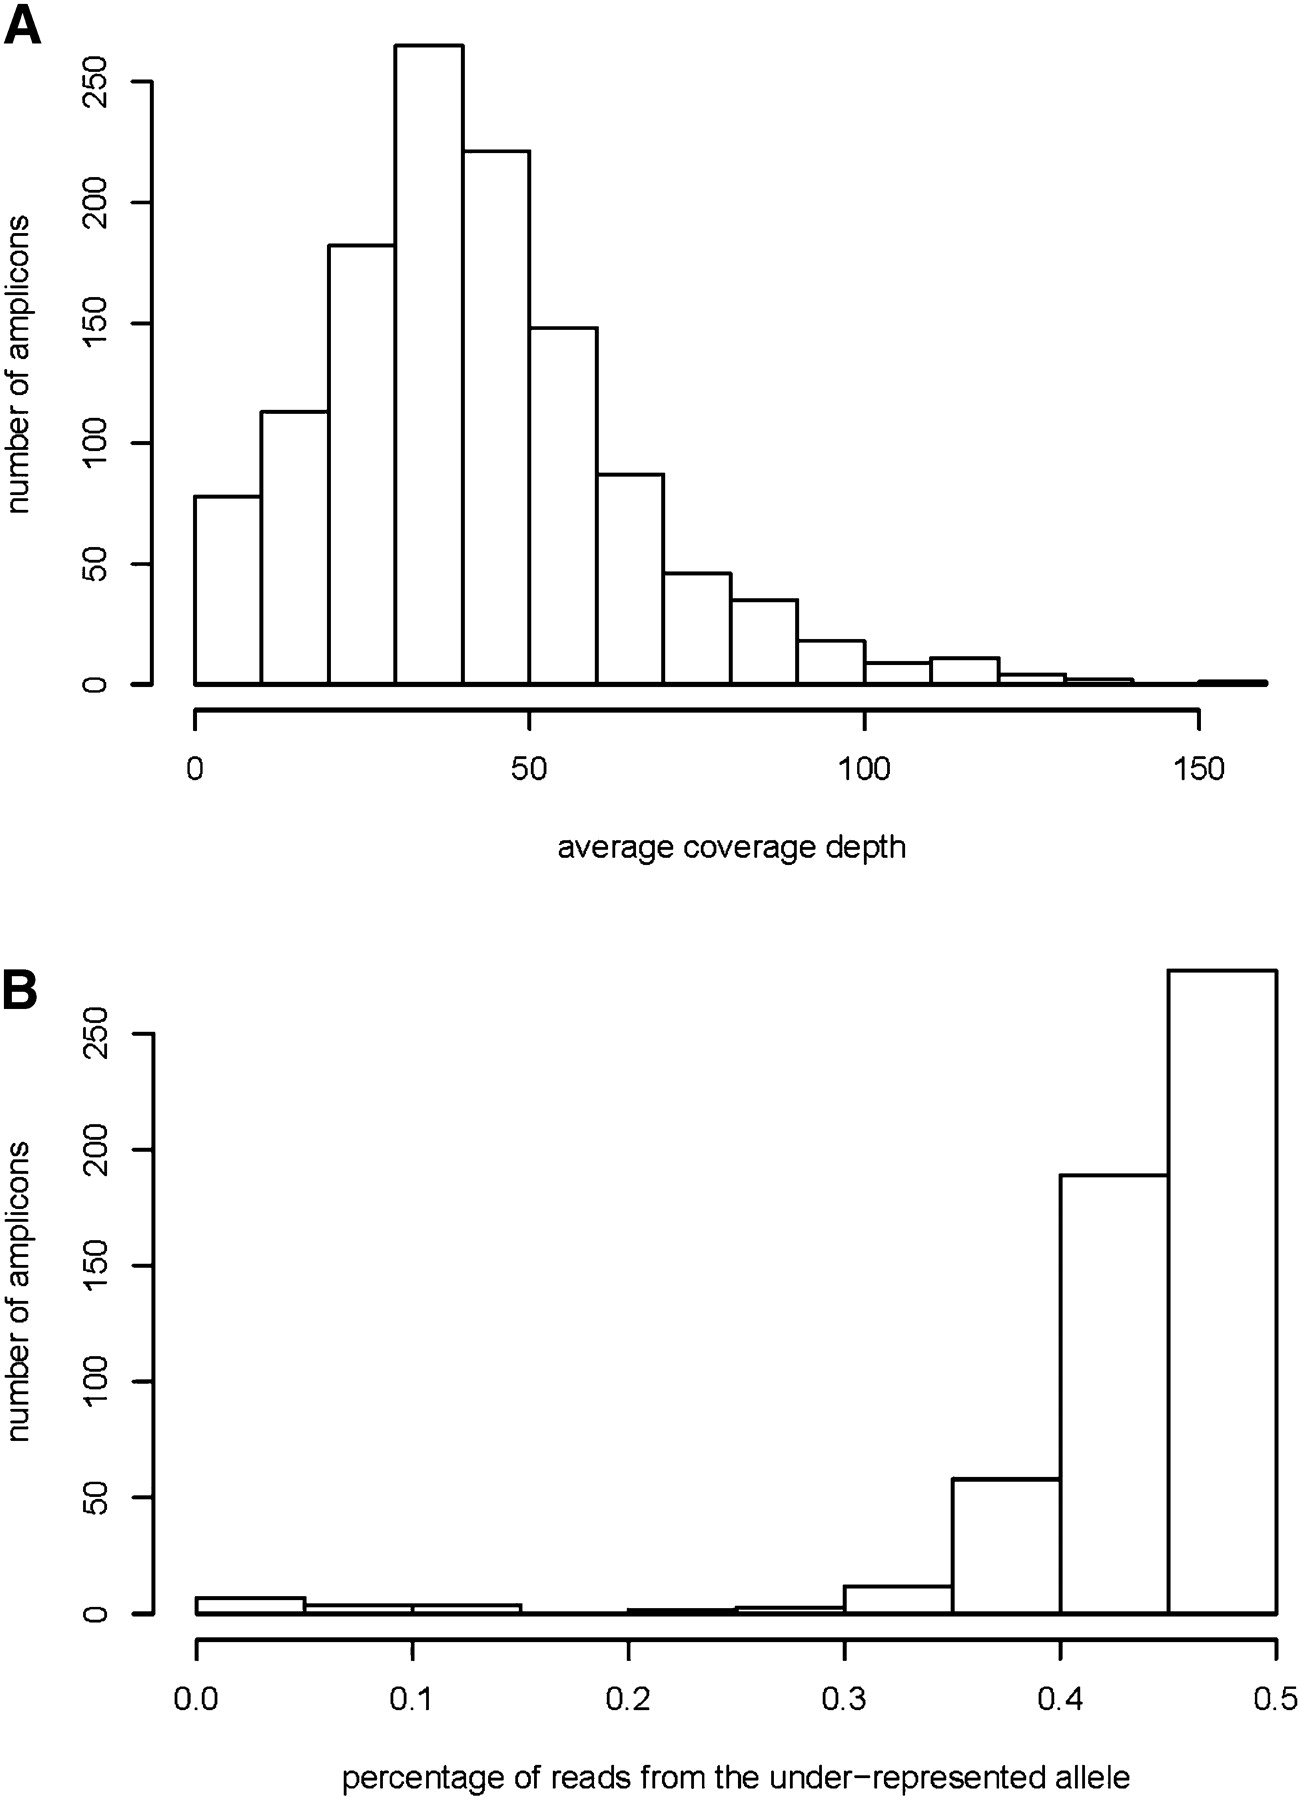
Figure 2.
(A) Average depth of coverage obtained for each successfully amplified LR-PCR fragment. Regions covered by two overlapping amplicons in the tiling path were excluded. (B) Frequency and magnitude of amplification bias, for amplicons with at least four known heterozygous sites, and average read coverage of at least 5×.


