
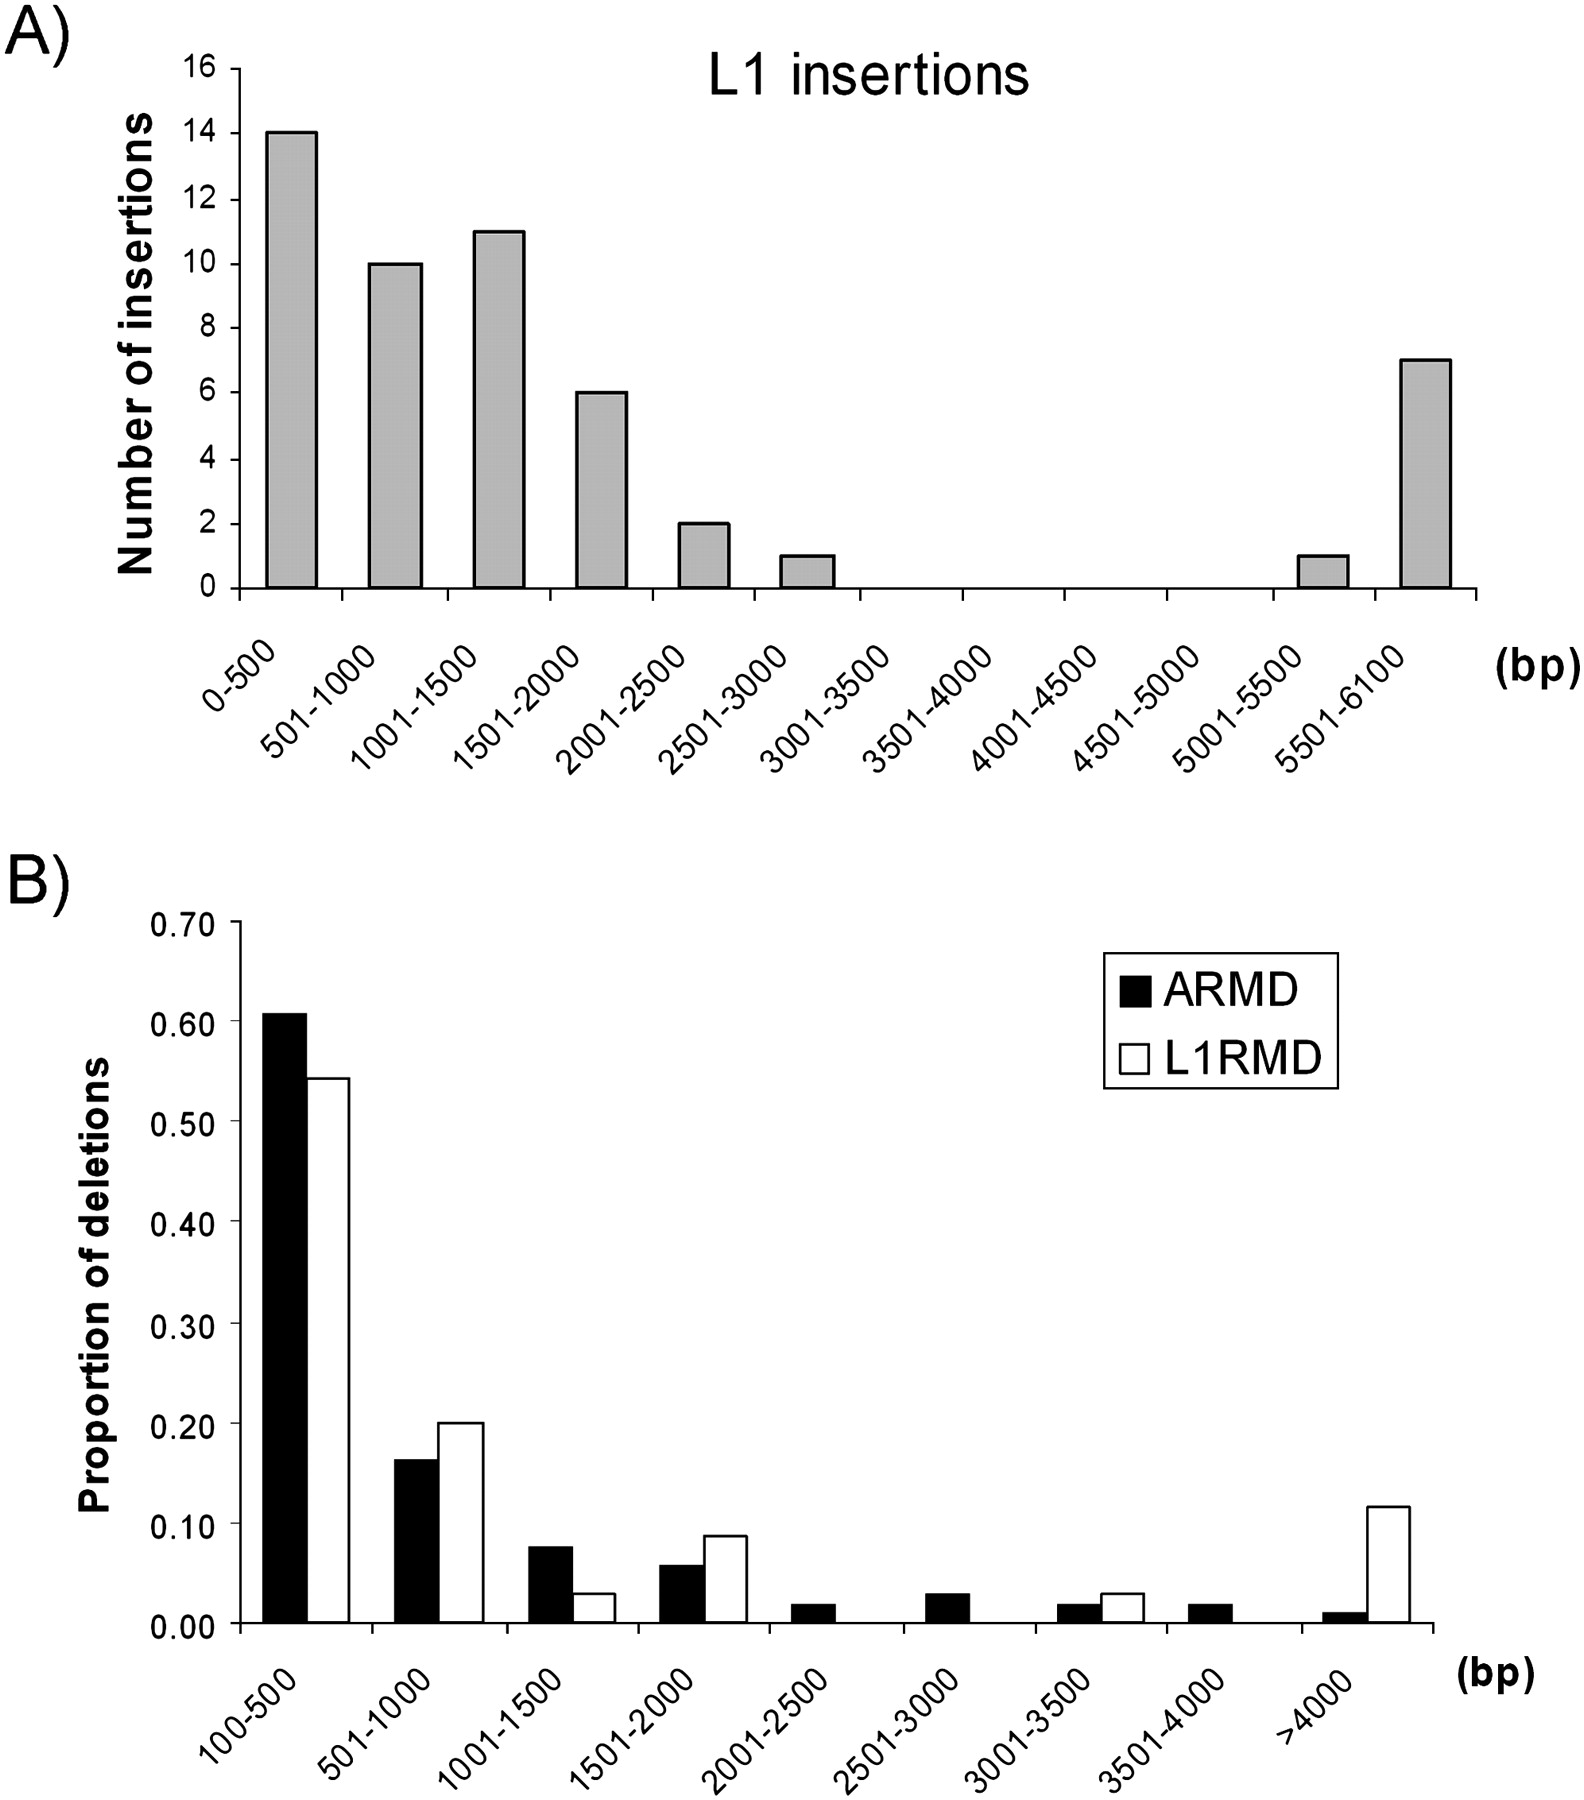
Figure 4.
(A) Size distribution of L1 insertions. The number of insertions in 500-bp bins is shown. (B) Size distribution of Alu- and L1-mediated deletions. The percentage of total events in 500-bp bins (except the last one) is shown.


