
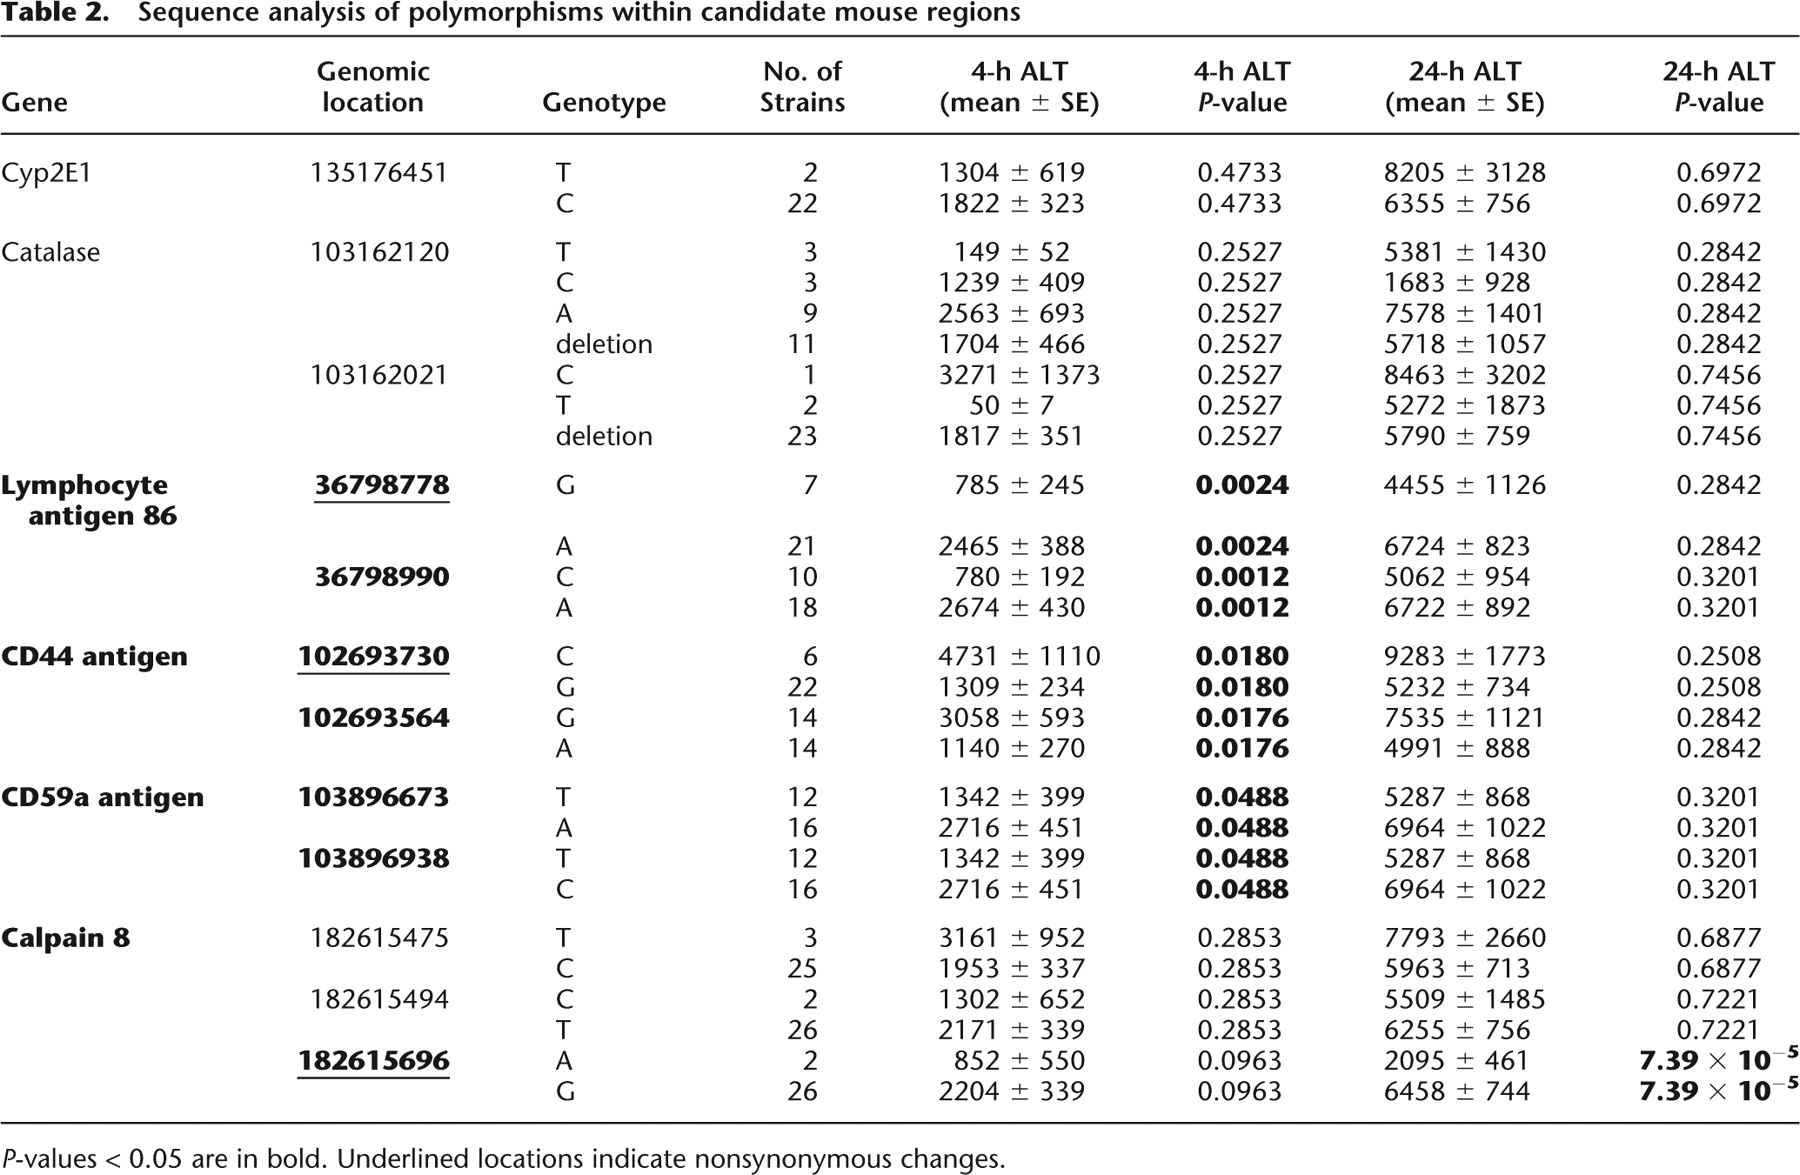
Table 2.
Sequence analysis of polymorphisms within candidate mouse regions
Click on table to view larger version.
-
P-values < 0.05 are in bold. Underlined locations indicate nonsynonymous changes.


