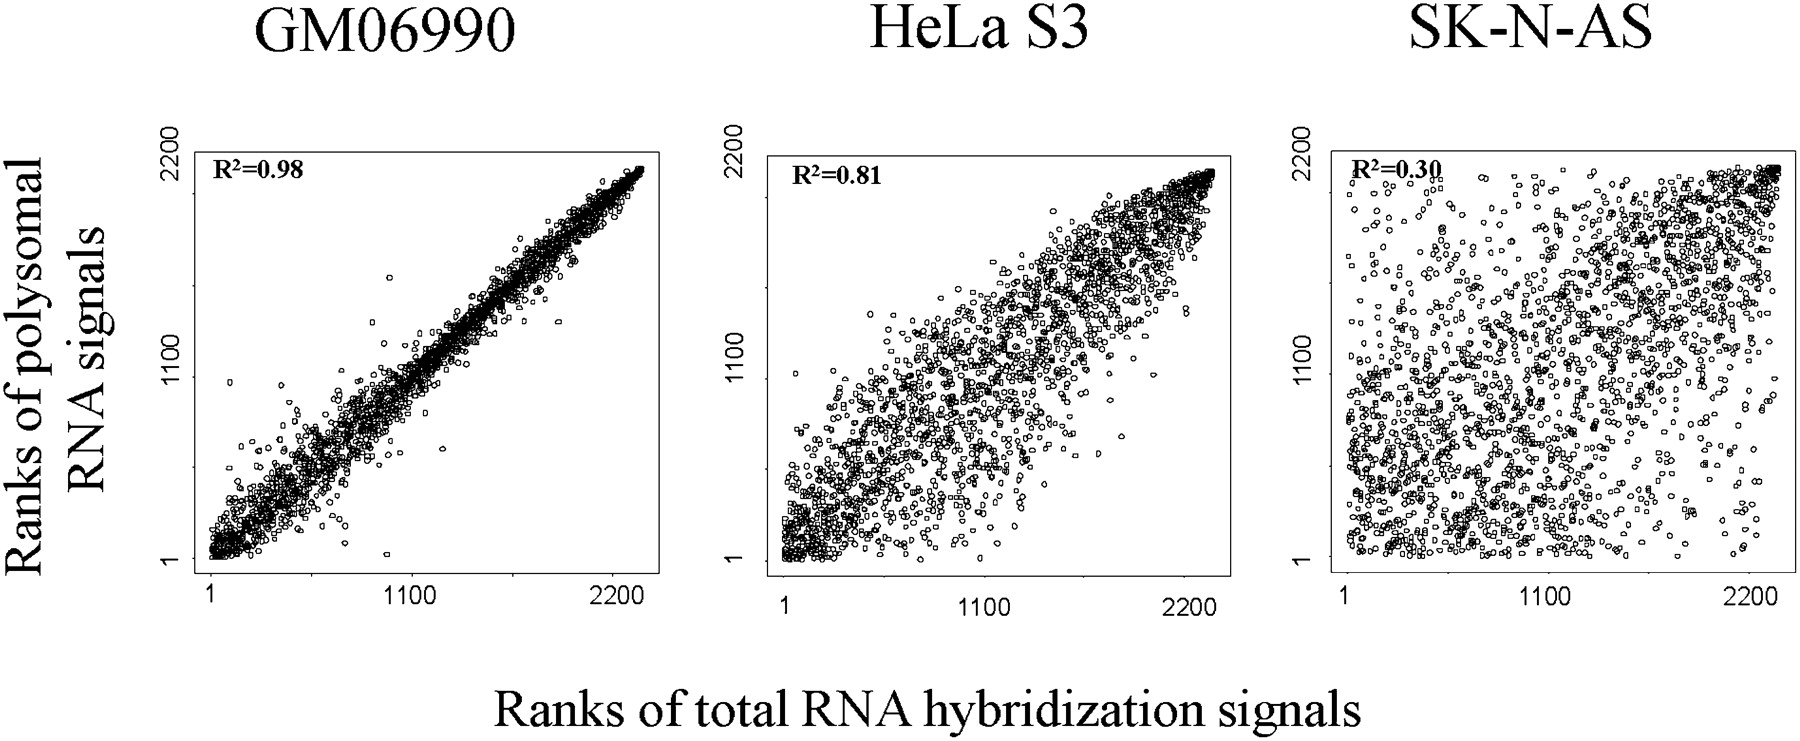
Transcriptional and post-transcriptional profile of human chromosome 21

(Downloading may take up to 30 seconds. If the slide opens in your browser, select File -> Save As to save it.)

Click on image to view larger version.

Figure 4.
Figure 4.

Nonparametric correlation of intensities between total RNA and polysome-associated RNA in three cell lines. Each dot corresponds to a RefSeq exon. R2 is a coefficient of determination.

This Article

  1. Genome Res. 19: 1471-1479

Preprint Server