
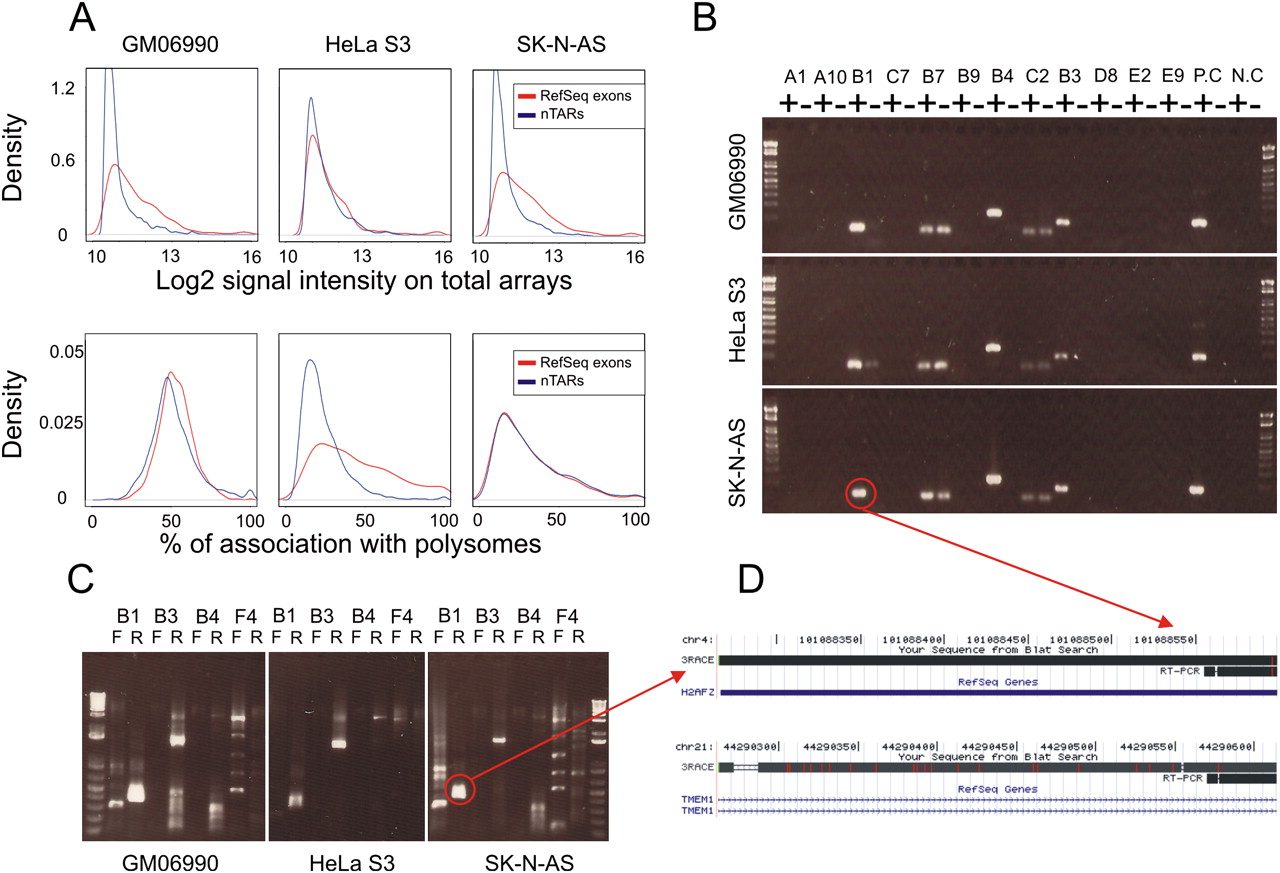
(A) (Top) Distribution of log2 intensities of array signals from total RNAs in three cell types. The red line corresponds to RefSeq exons and the blue line to nTARs. (Bottom) Distribution ratios of polysome associated RNA/Total RNA signals. (B) RT-PCR of selected nTARs. (+) RT+, (−) RT−, (P.C) positive control (RefSeq exon), (N.C) negative control (nontranscribed DNA). (C) RACE experiment from forward strand and reverse-strand primers in three cell types. The red circle indicates an example of nonspecific cross-hybridization. (D) BLAT results from the UCSC Genome Browser of B1 nTAR and RACE from the SK-N-AS cell line. Coordinates of nTARs are presented in Supplemental Table 1.


