
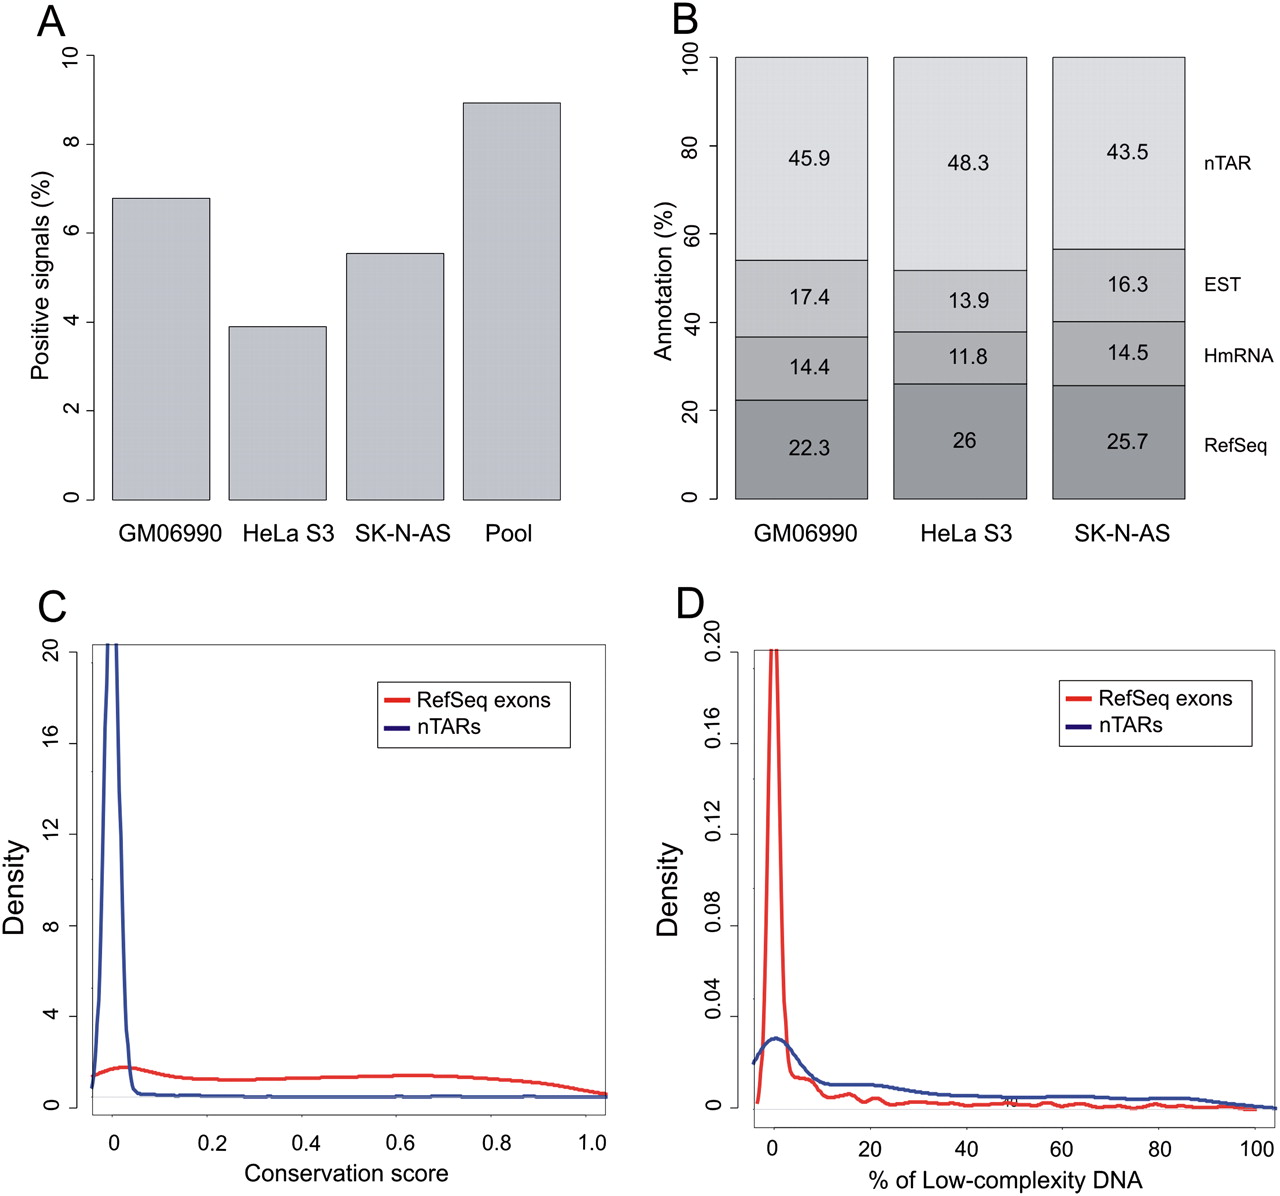
Figure 2.
(A) Percentage of positive signals detected on the custom tiling array when hybridizing total RNA from three different cell lines. (B) Overlap of positive signals with known annotations: (1) RefSeq exons; (2) human mRNAs (not included in 1); (3) ESTs (not included in 1 and 2); (4) nTAR (novel transcriptionally active regions). (C) Comparative conservation density plot of RefSeq exons and nTARs using phastCons scores. (D) Comparative density plot of percentages of low-complexity DNA between RefSeq exons and nTARs.


