
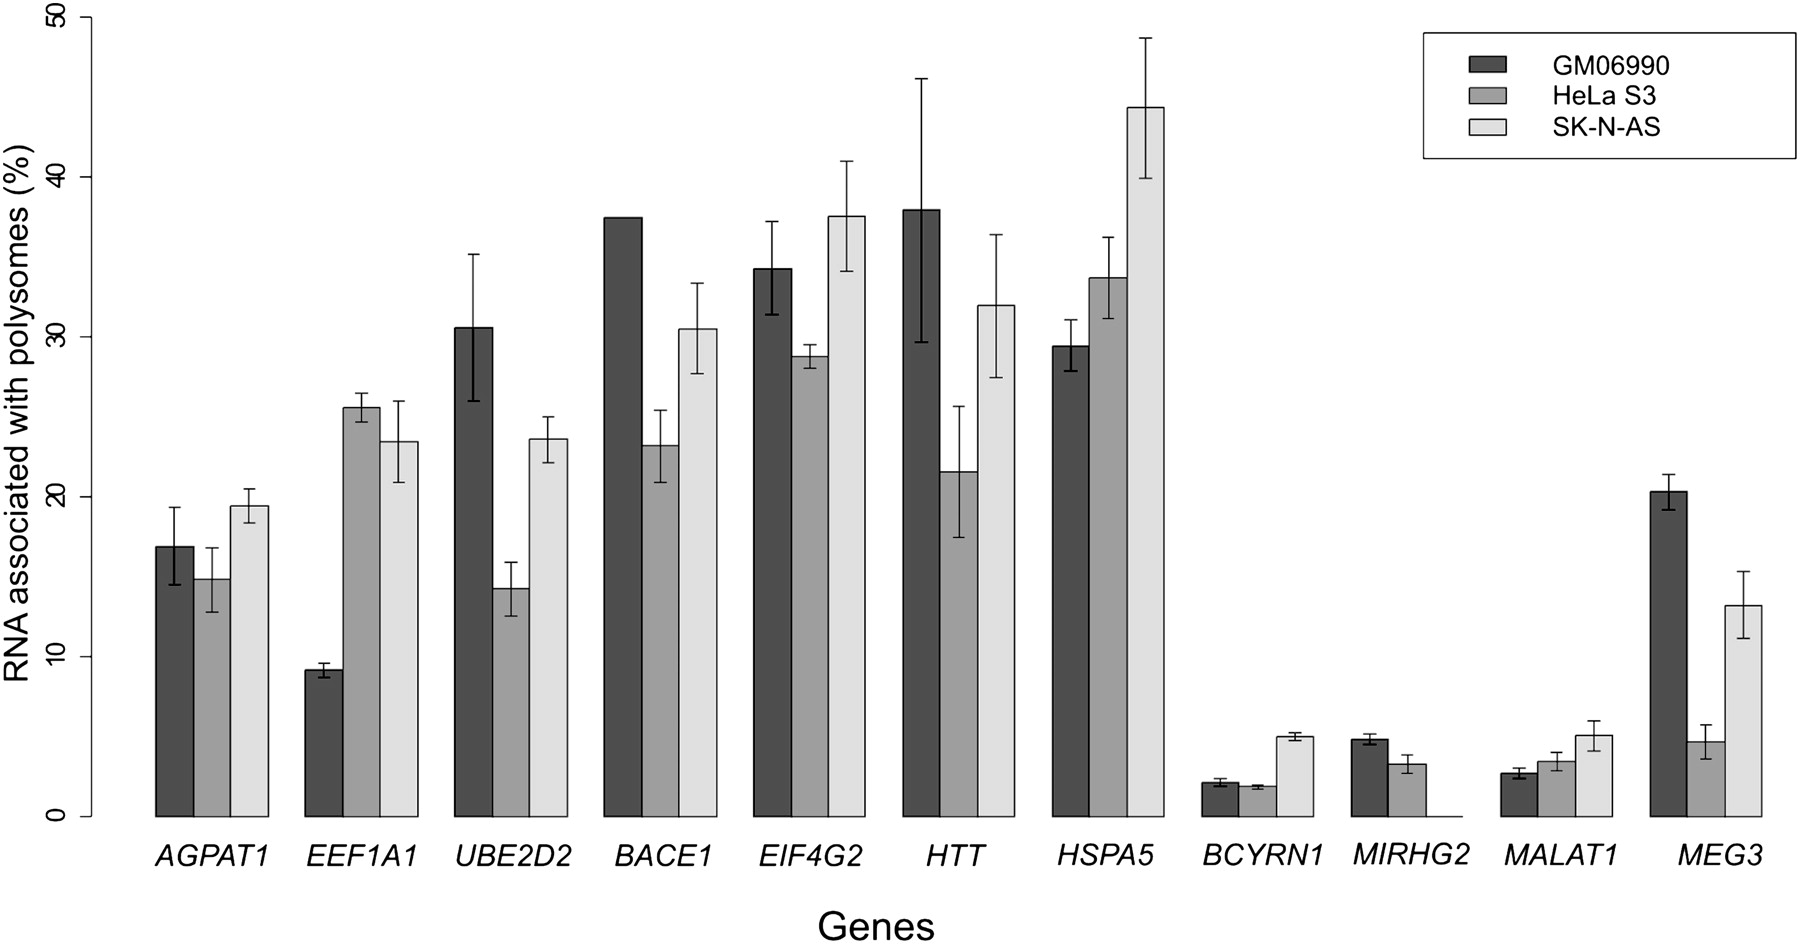
Figure 1.
Percent level of transcript representation in the polysomal fraction as measured using quantitative reverse transcription PCR. Bars correspond to the standard deviation. BCYRN1, MIRHG2, MALAT1, MEG3 are noncoding genes, while all others are protein-coding genes.


