
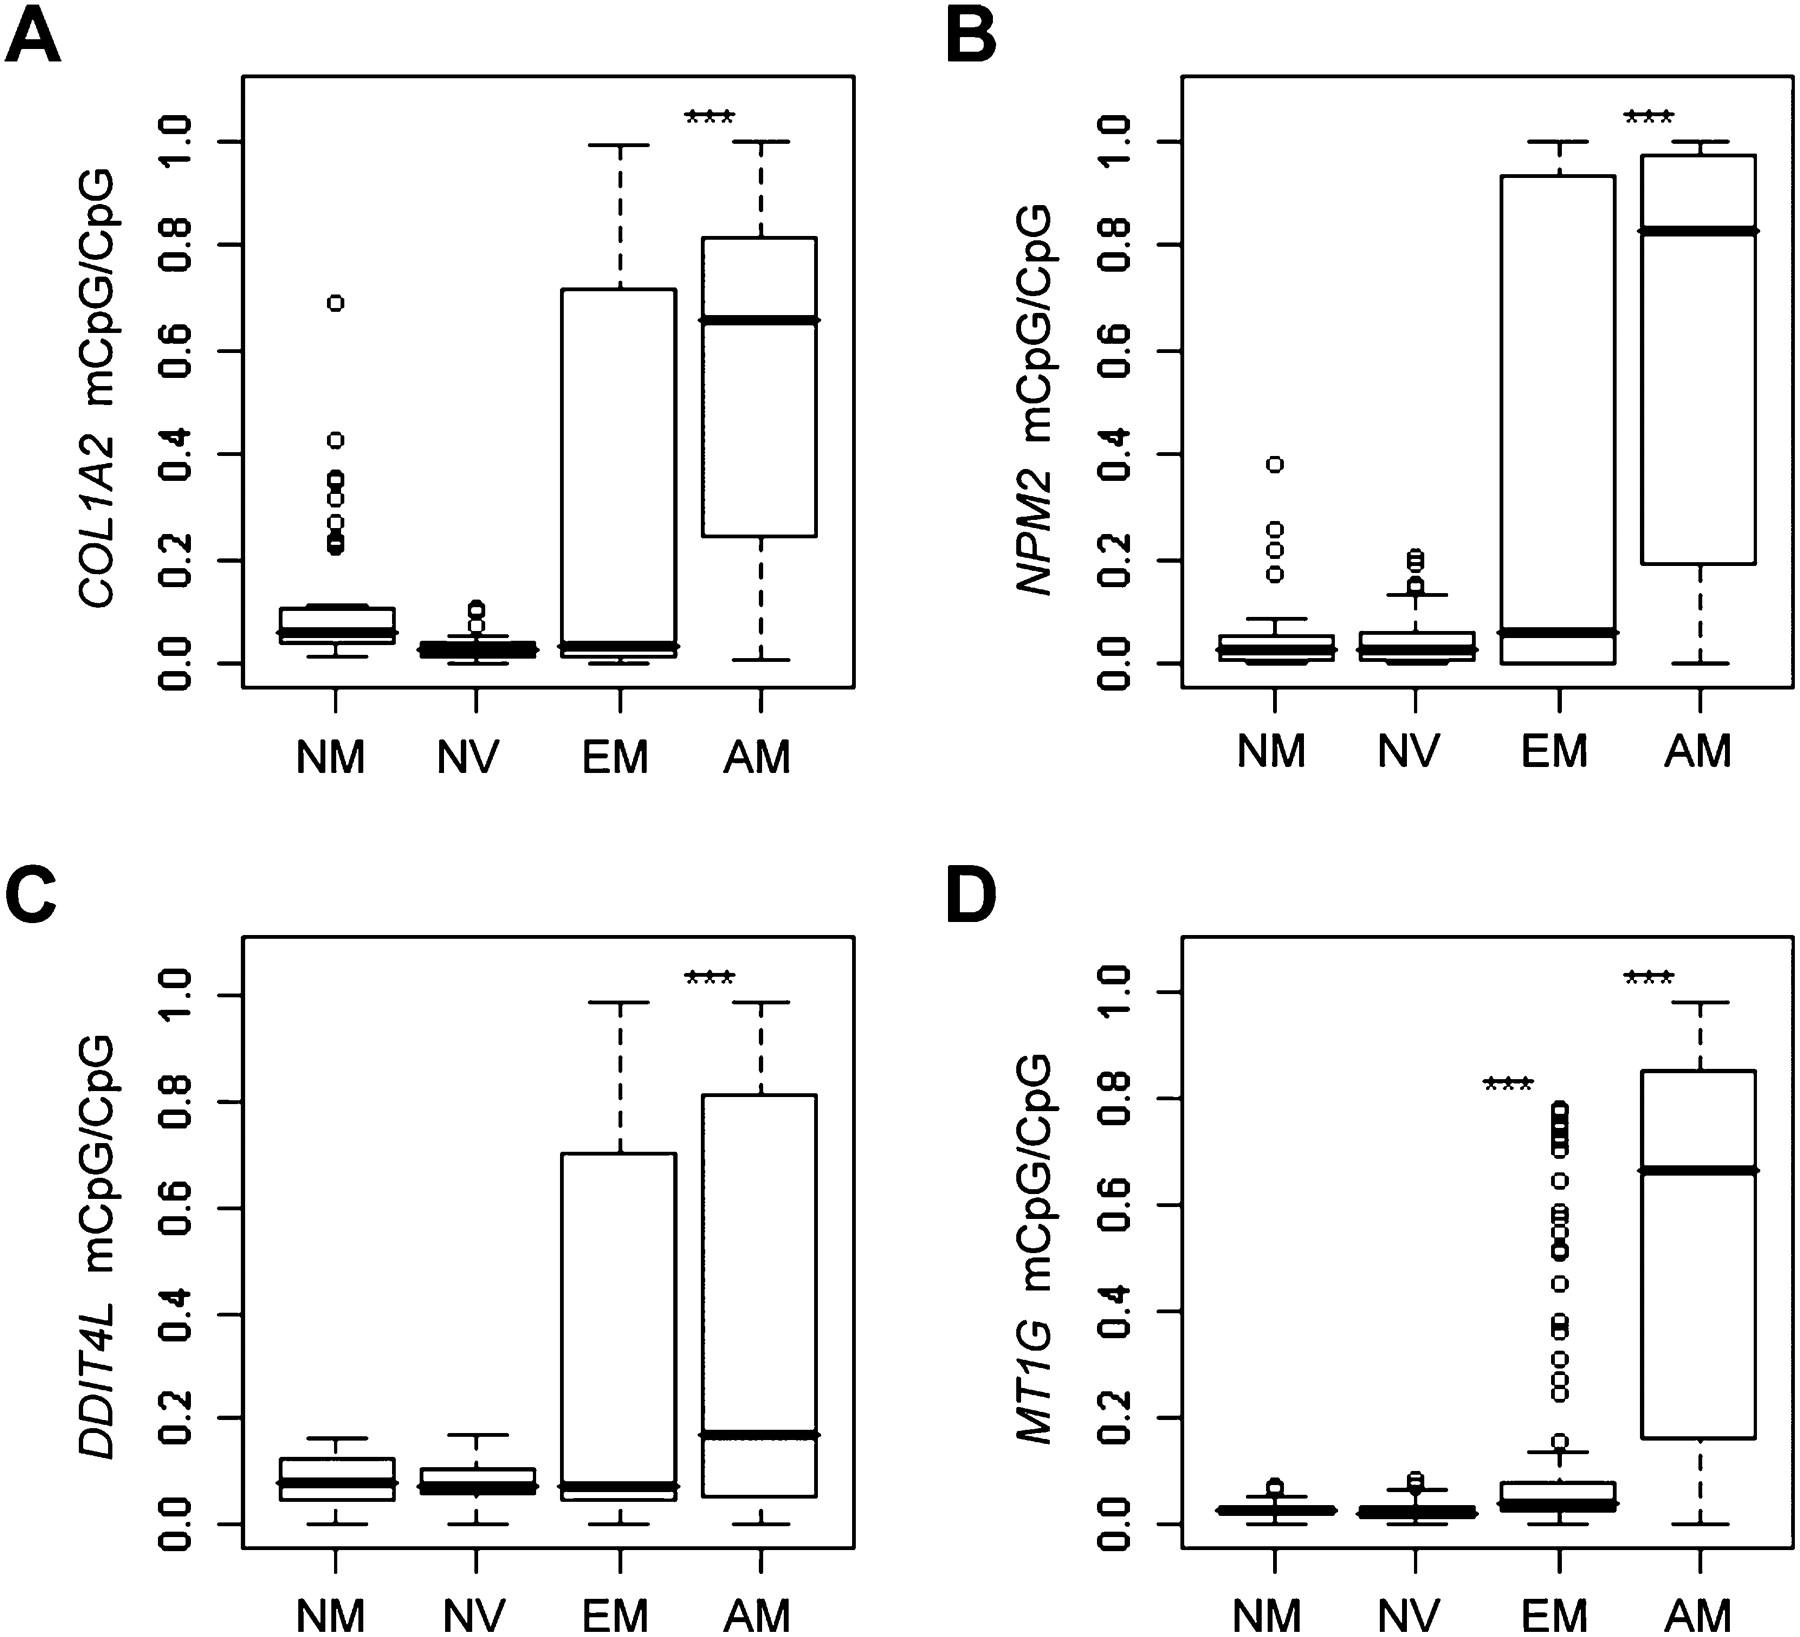
Figure 5.
Promoter methylation of selected markers in early-passage cells results from sequencing of BS. Modified DNA was used to determine the methylation level of each CpG dinucleotide within each proximal promoter. The distribution of CpG-relative methylation is displayed in normal melanocytes (NM, n = 5), nevi (NV, n = 6), early-stage melanomas (EM, n = 8), and advanced-stage melanomas (AM, n = 10). P-values for each group were determined relative to NM using a two-sample nonparametric Wilcoxon test. 0.05 < *P ≤ 0.01, 0.01 < **P ≤ 0.001, ***P < 0.001. (A) COL1A2; (B) NPM2; (C) DDIT4L; (D) MT1G.


