
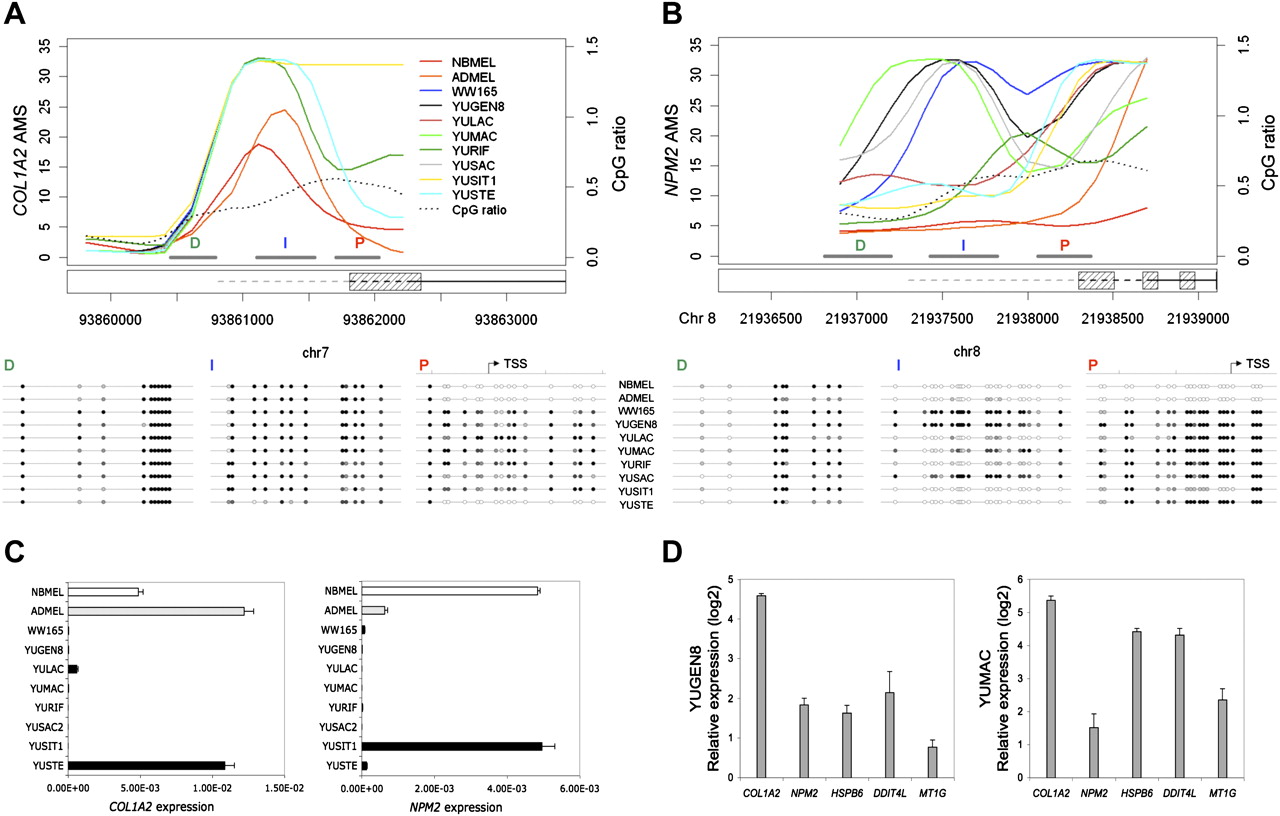
Promoter methylation and gene expression for selected markers. (A) Probe-level AMS, CpG ratio, and sequence of BS-modified genomic DNA for the proximal (P), intermediate (I), and distal (D) promoter regions of COL1A2 in newborn (NBMEL) and adult (ADMEL) melanocytes and eight melanoma cell strains; gray bars indicate the amplicons of BS sequencing; D, distal, I, intermediate, and P, proximal for each promoter region; 1 kb upstream region (dashed line), exon (dashed box), and coding sequences (solid black line) for each RefSeq in the locus are displayed; CpGs are represented as circles, and white, gray, and black shades refer to the average of mCpG/CpG (0 to 1) for each sample. (B) Same as A, for NPM2. (C) COL1A2 and NPM2 expression levels measured by real-time RT-PCR. Expression levels were normalized to that of ACTB. (D) Restoration of gene expression (COL1A2, DDIT4L, NPM2, and MT1G) after treatment with Aza (0.2 μM). Gene transcripts were measured by real-time RT-PCR, and expression levels were normalized to that of ACTB. The histogram shows log2 increase after Aza treatment for YUGEN8 and YUMAC melanoma cells.


