
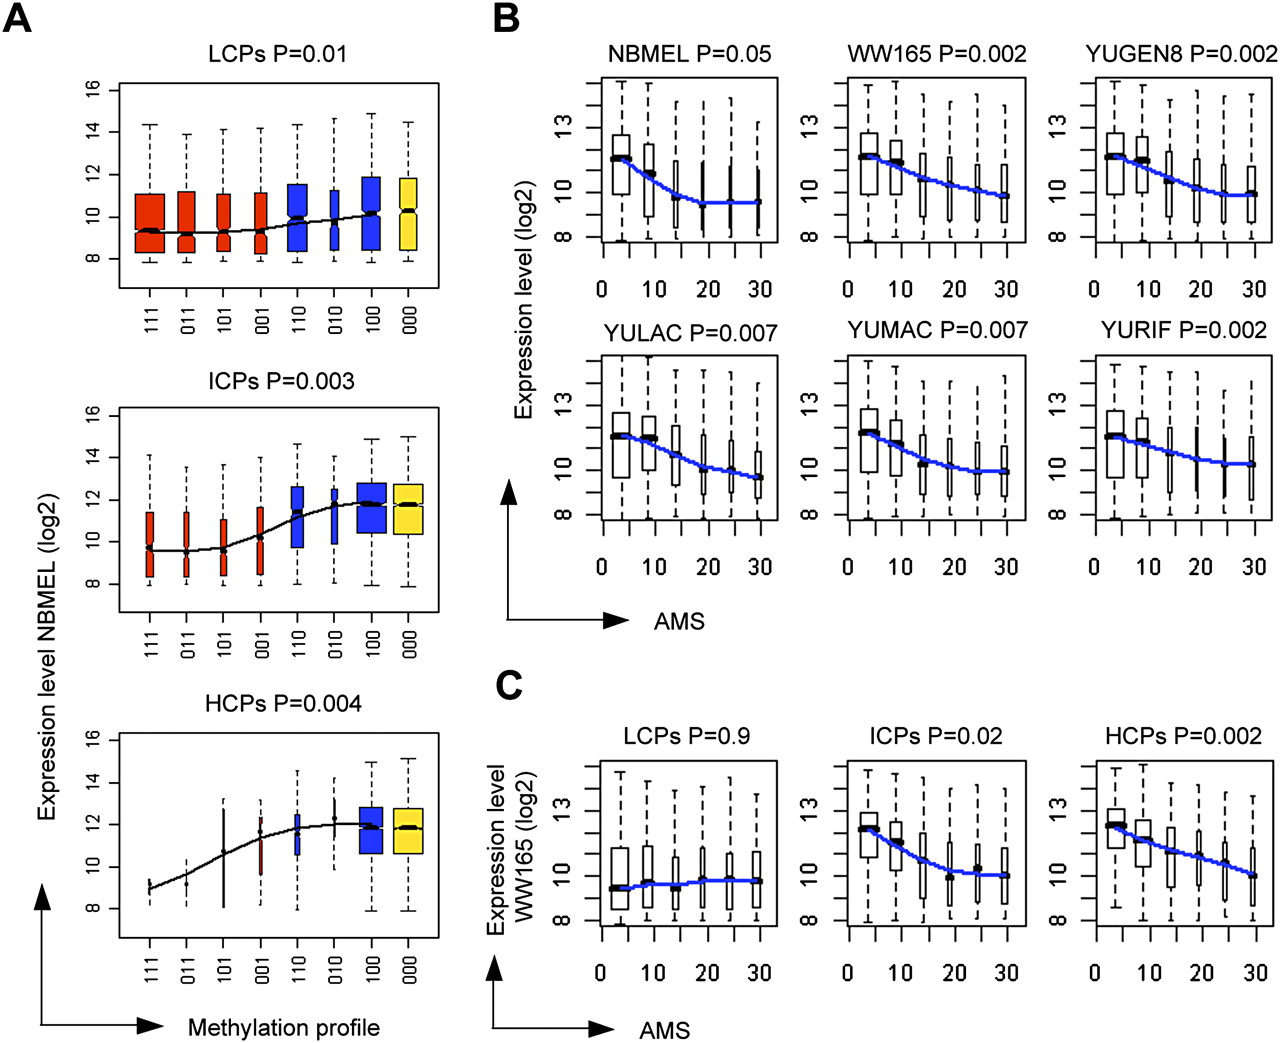
Promoter methylation and transcriptional repression. (A) Gene expression in normal melanocytes (NBMEL) under the control of promoters with each methylation profile in each promoter category; red and blue groups indicate promoters with and without proximal methylation (XX1 and XX0 profiles, respectively); yellow indicates unmethylated promoters; the groups range from fully methylated to unmethylated from left to right, and the order is based on the progressive absence of methylation from distal to proximal regions; smoothing over the median for each group is shown. (B) Gene expression in normal melanocytes (NBMEL) and five melanoma cell strains as a function of the probe-level AMS of proximal promoters; smoothing over the median for each group is shown. (C) Gene expression of WW165 primary melanoma cells for each promoter category as a function of the probe-level AMS of proximal promoters; smoothing over the median for each group is shown. For each panel the trend P-value is indicated (see Methods).


