
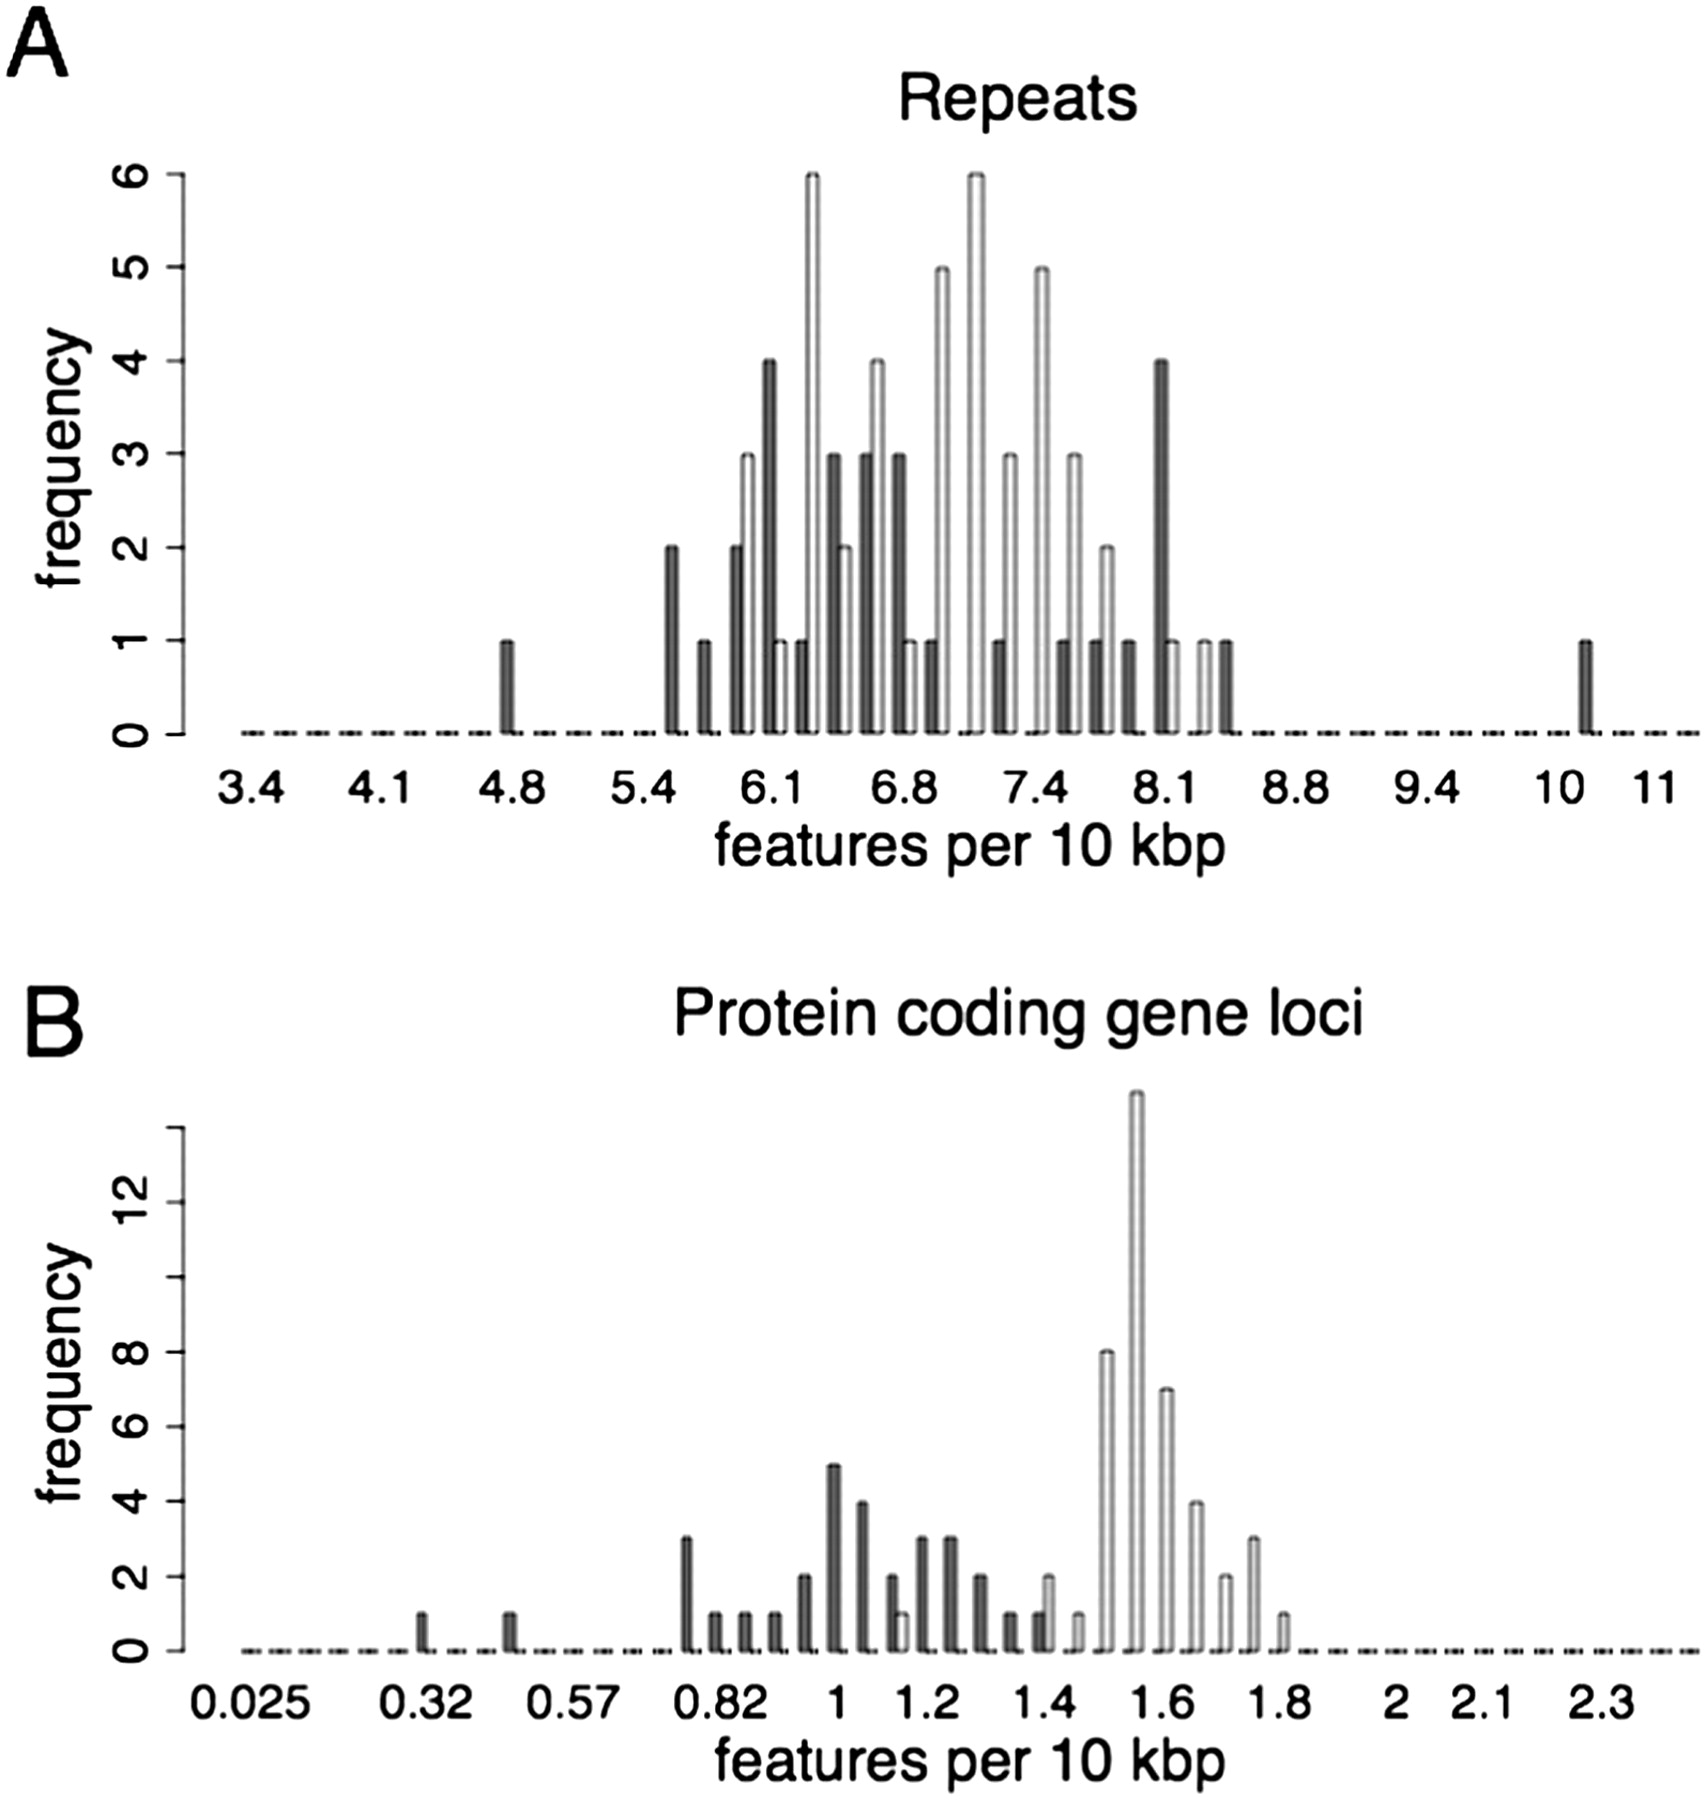
Figure 2.
Density of TIGR annotated features in 21-mer superclusters versus sequences between superclusters. The frequency of annotated repeats (A) or annotated protein coding genes (B) per 10 kbp is plotted for 21-mer superclusters (dark gray) versus the sequences between the 21-mer superclusters (light gray). The difference in the frequency is statistically significant for protein coding gene loci (P < 2.2 × 10⁻¹⁶), but not statistically significant for the repeats (P = 0.29).


