
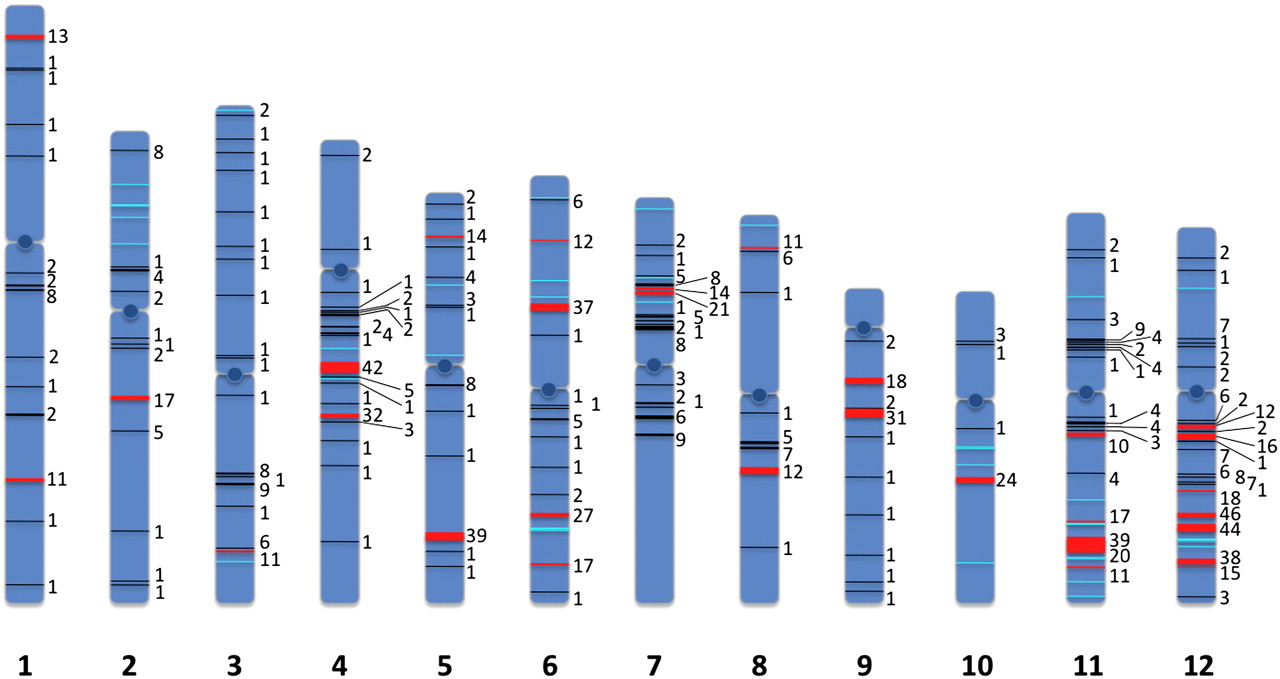
Figure 1.
Distribution of 21-mer superclusters and phased 24-mer clusters in the rice genome. Regions of 21-mer clusters are represented as black lines (<10 clusters) or if they are superclusters as red lines (≥10 clusters). Phased 24-mer clusters are represented as cyan lines. The number of individual clusters within a region is indicated next to the line.


