
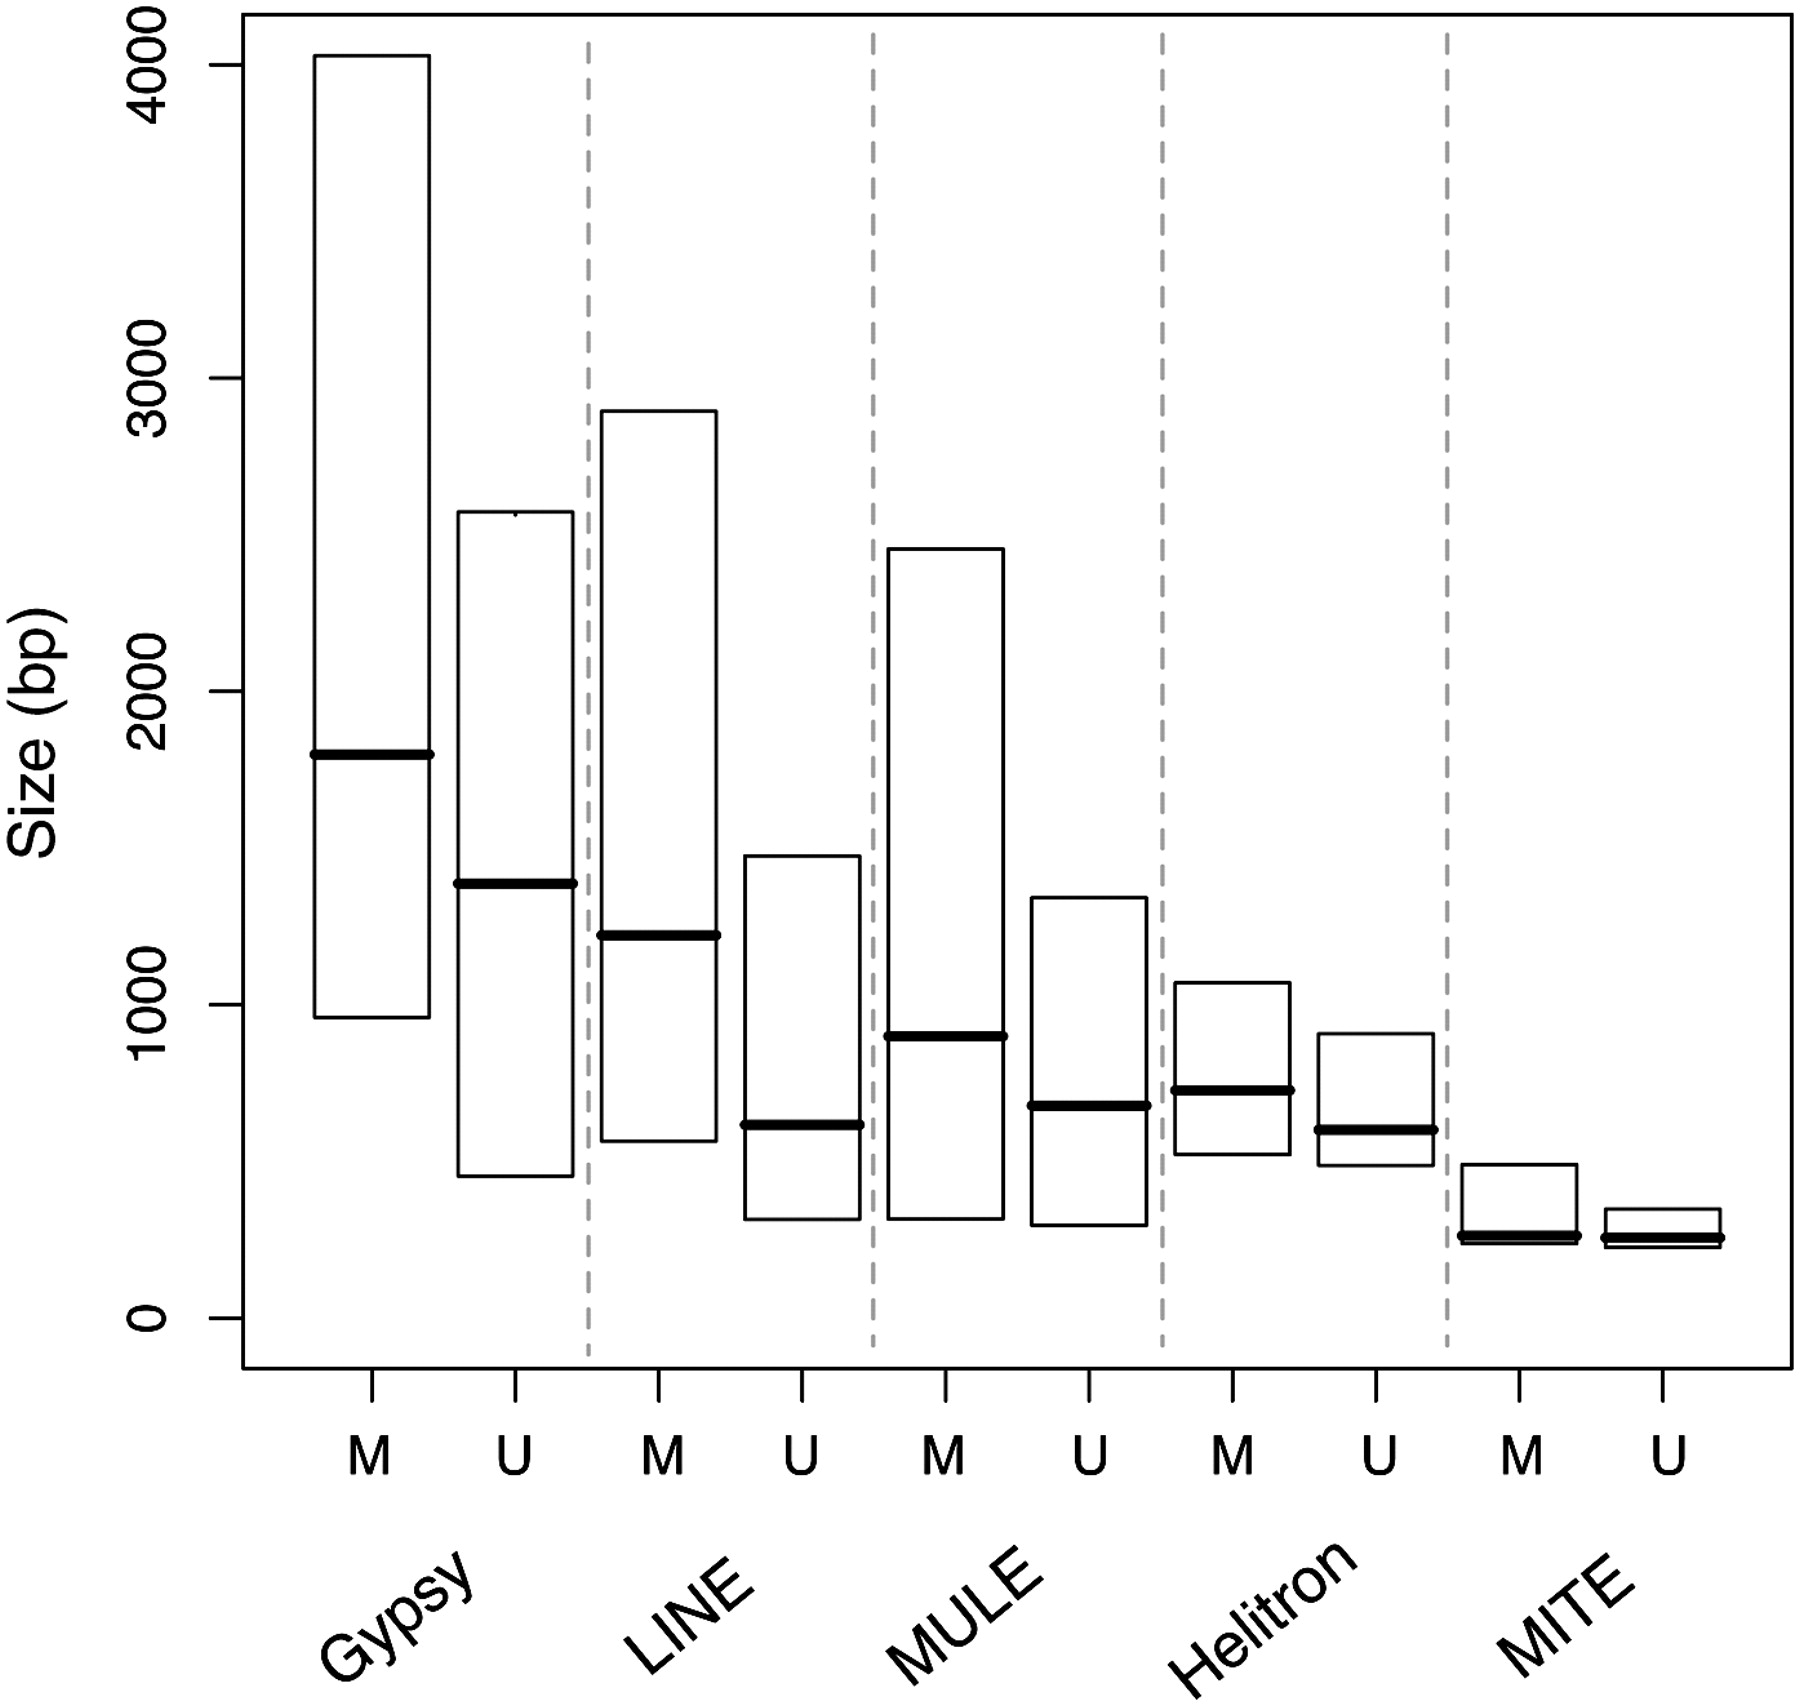
Figure 4.
Box plot showing sizes of methylated and unmethylated TEs from five representative families. Horizontal lines display medians; box heights, interquartile range. M, methylated insertions; U, unmethylated insertions. Unmethylated elements are significantly smaller than methylated elements in each family (MWU P < 0.01).


