
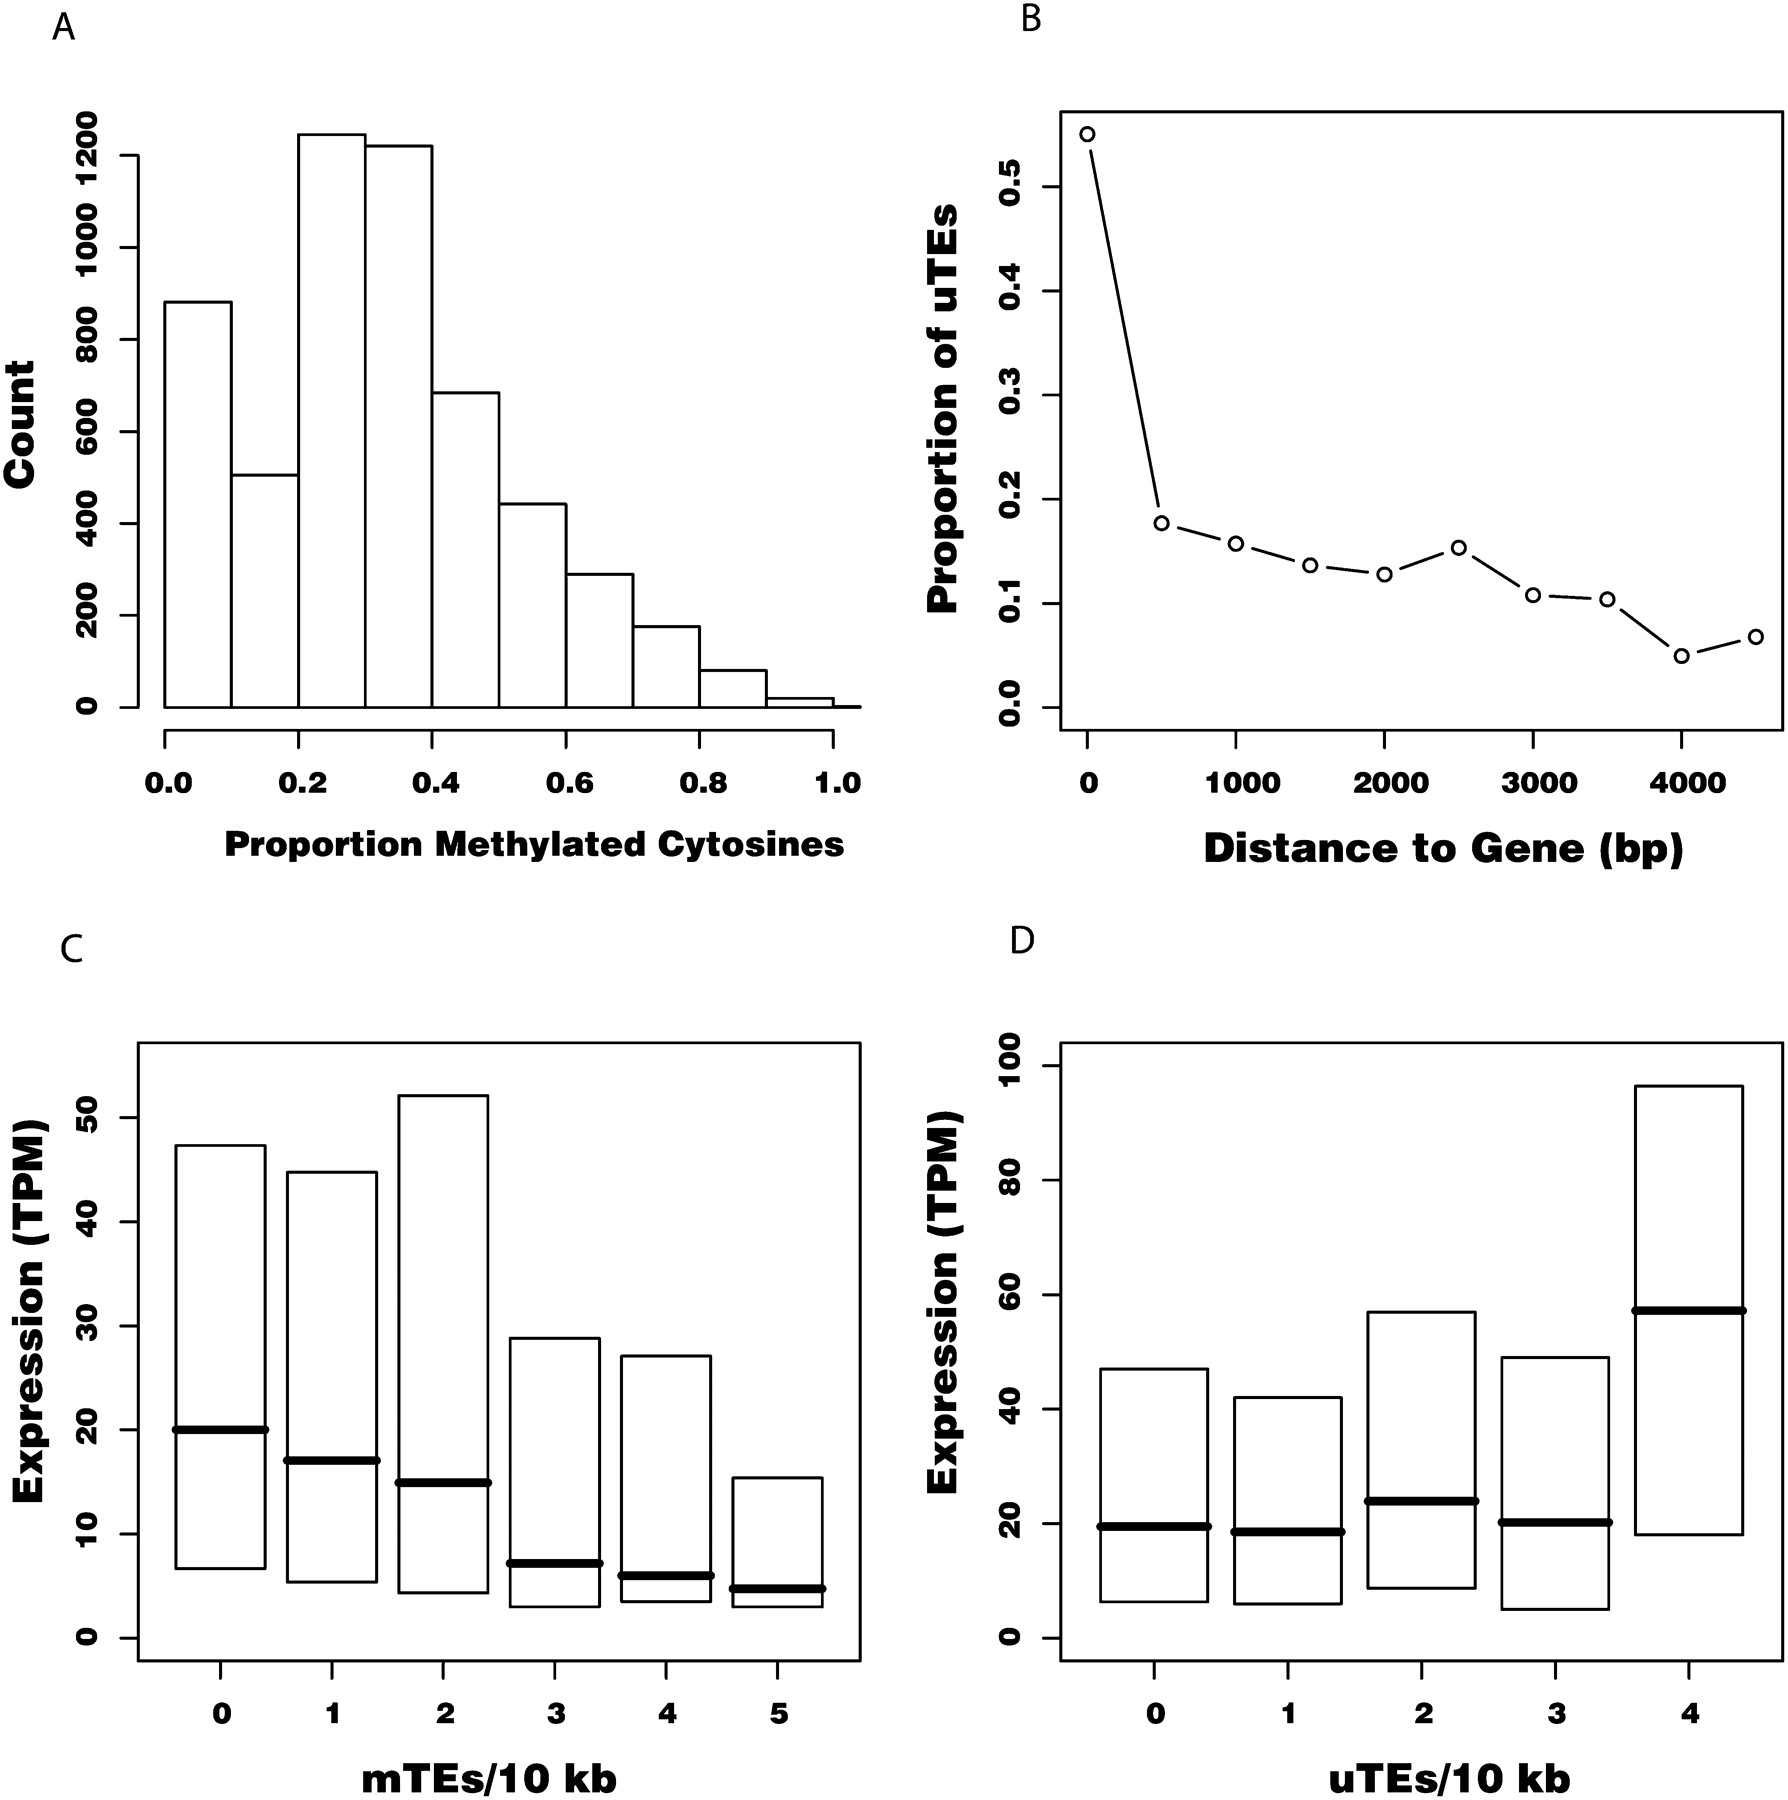
(A) Histogram showing the proportion of methylated cytosines for n = 4665 TEs, based on bisulfite-treated genomic DNA sequencing (BS-seq) data. Note the large proportion of TEs with <10% methylation, which we deemed as “undermethylated TEs” (uTEs). TEs with >10% methylation are referred to as “methylated TEs” (mTEs). (B) Proportion of uTEs in 500-bp windows of increasing distance from genes. “0 bp” represents TEs within genes. Half of the TEs within genes are unmethylated, but this proportion drops below 20% within 1.5 kb. (C,D) Box plots showing normalized expression for genes as a function of density of mTEs (C) or uTEs (D) within a 10-kb window centered on the gene. Gene expression is measured in transcripts per million (TPQ). Box heights represent inter-quartile distance; horizontal lines, median value for each category.


