
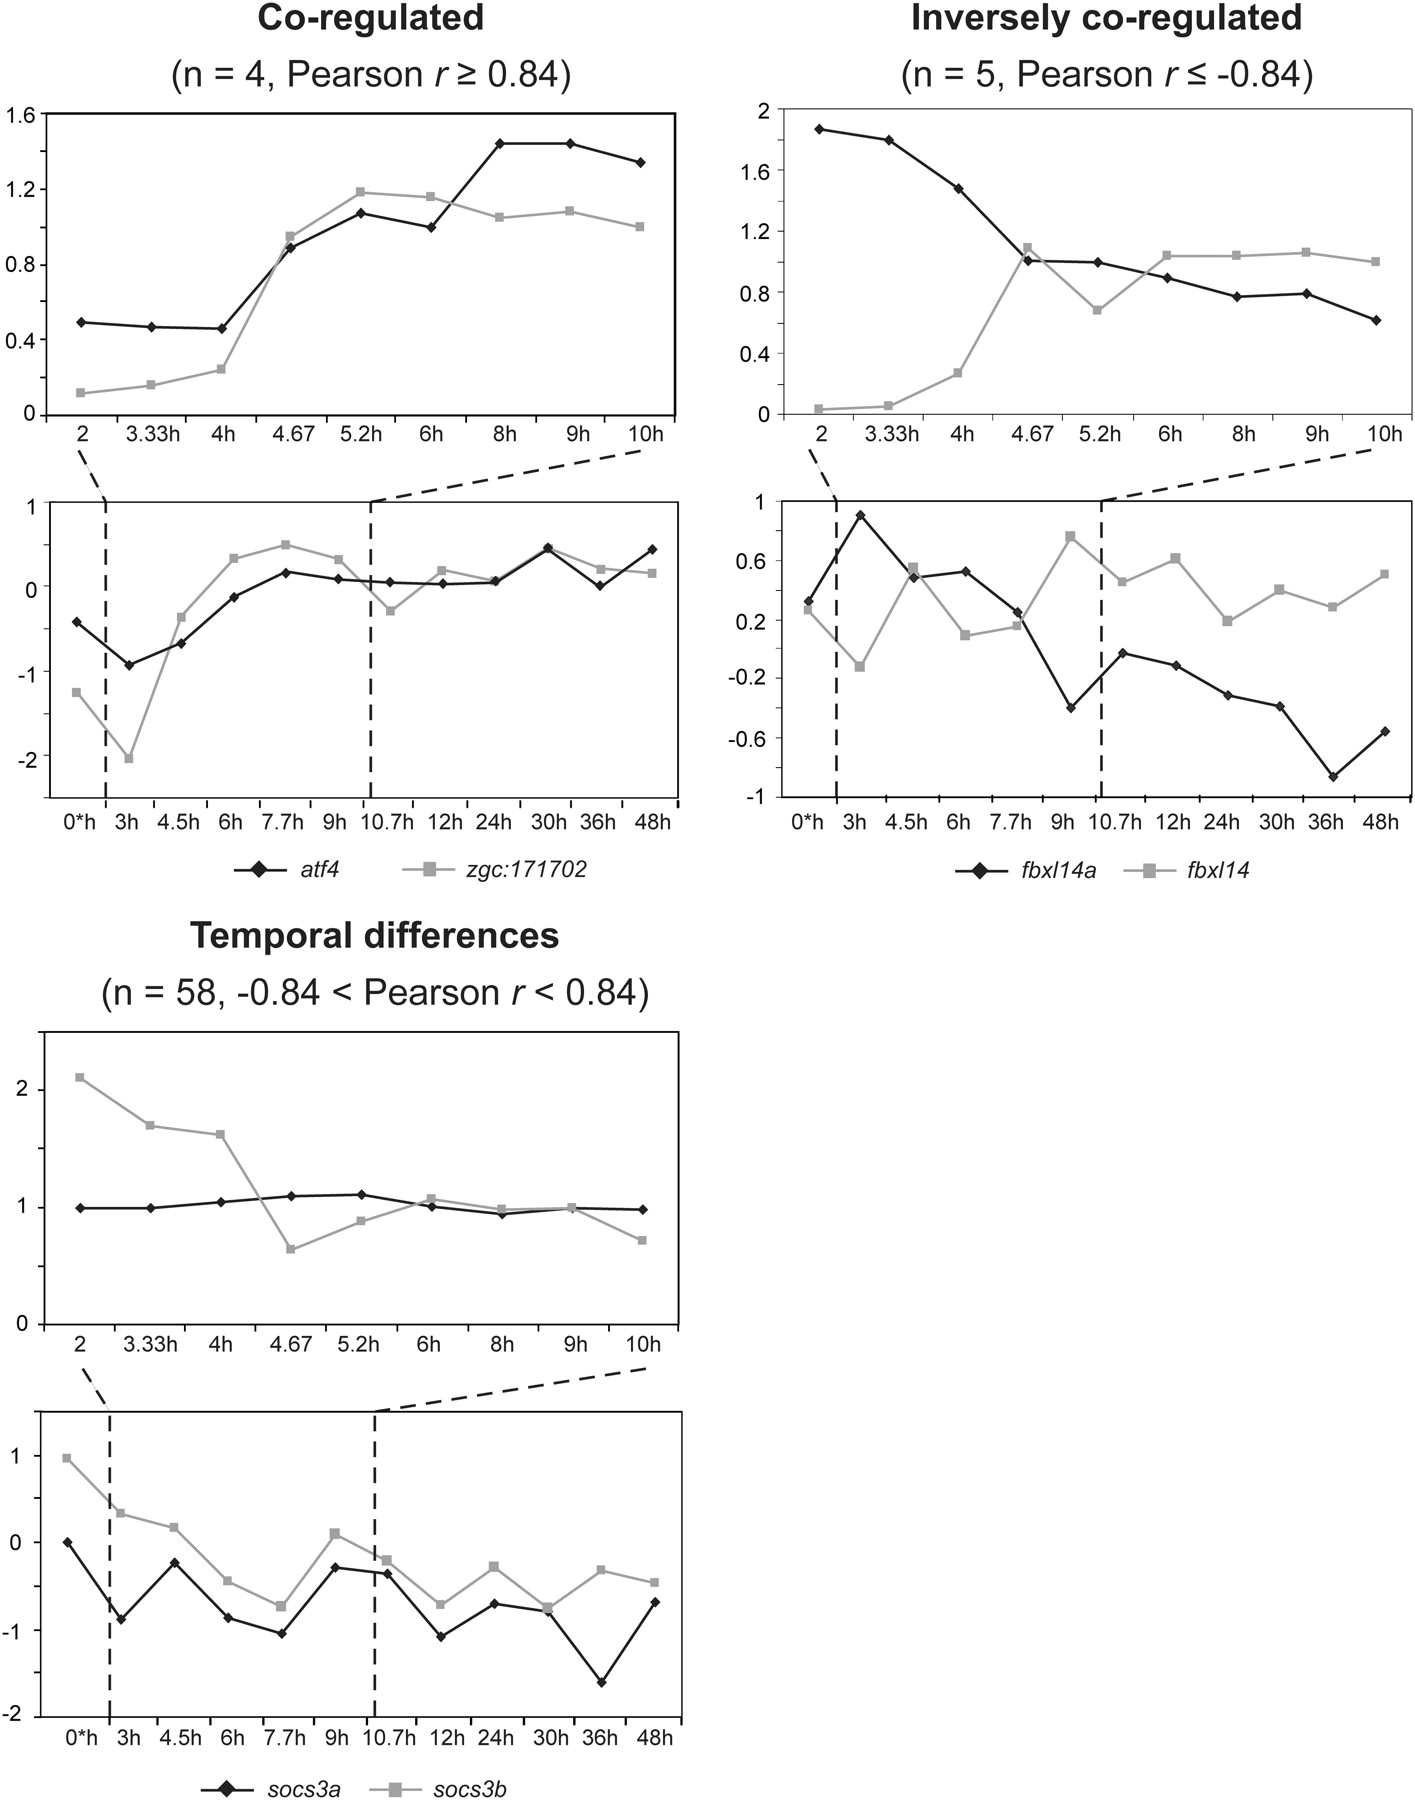
Temporal expression of zebrafish duplicated genes. Expression profiles were grouped into three categories (coregulated, inversely coregulated, temporal differences) based on their Pearson correlation coefficients (r) and statistical significance thresholds determined from the distribution of r values for 100,000 random probe pairs, following the approach of Blanc and Wolfe (2004). Only one gene pair is shown here to represent each category. In each category, the top and bottom panels refer to microarray data from Wilkins et al. (S Wilkins, M Kerr, M Köppen, B Gardiner, D Taylor, C Simons, M Landsberg, S Grimmond, C Heisenberg, and A Perkins, in prep.) and Mathavan et al. (2005), respectively, while the dashed lines indicate overlapping time points measured in both data sets. The scale on the y-axis differs between the two microarray data sets due to the different normalization methods used by the investigators.


