
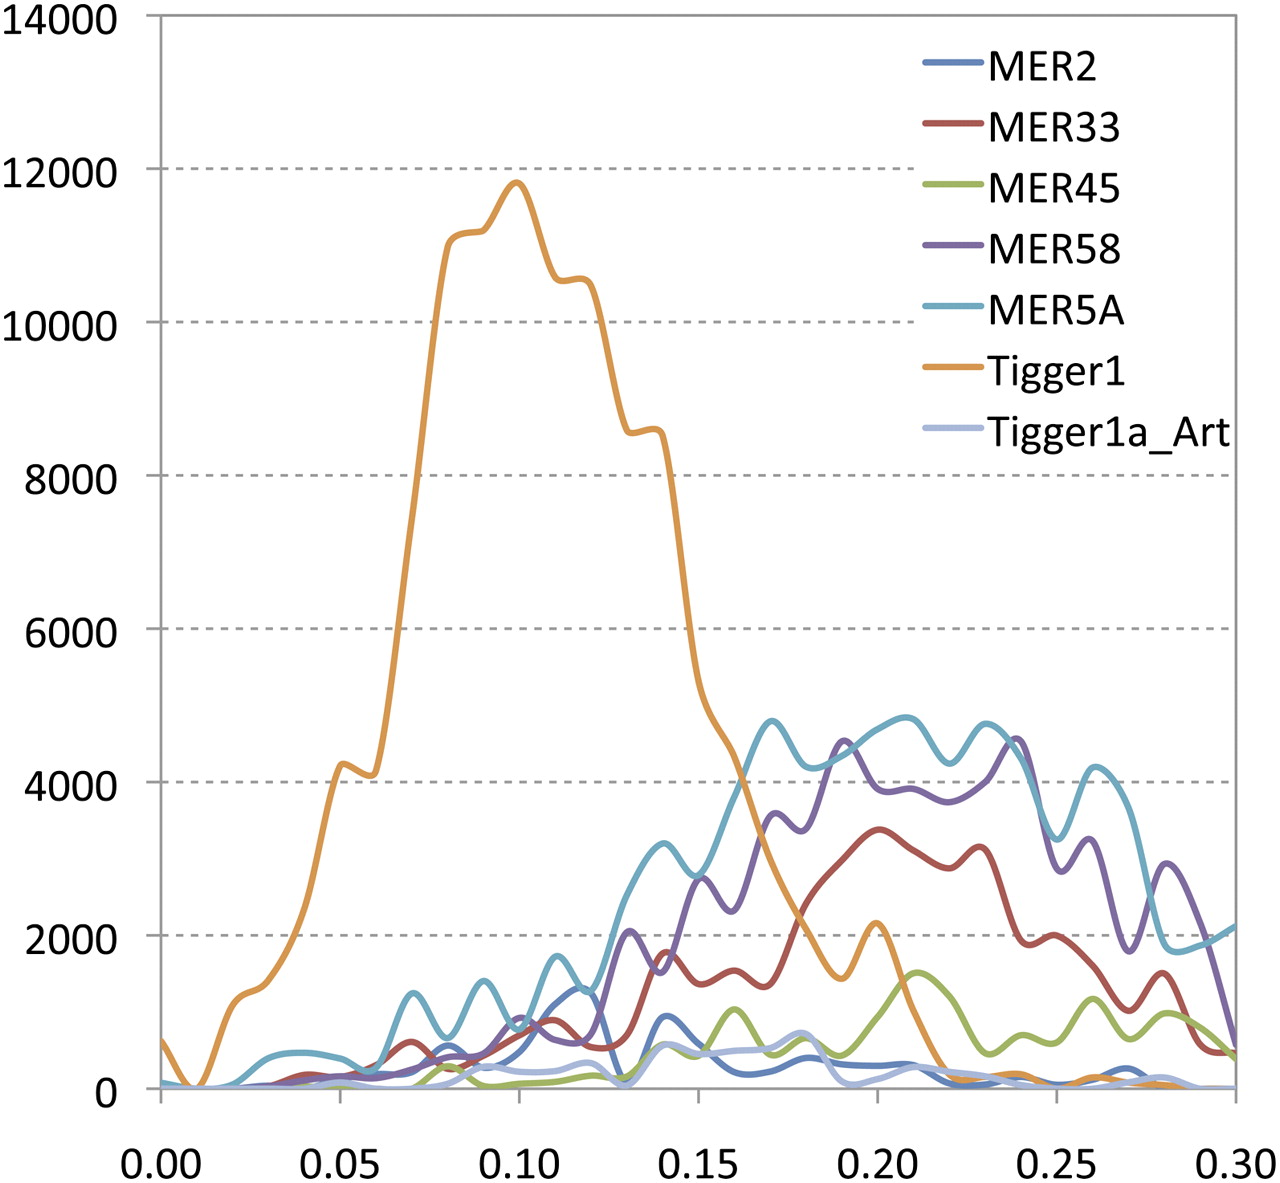
Figure 6.
Comparison of the age distributions of different types of DNA transposons in mammoth. The x-axis represents the percent substitution from consensus sequences. The y-axis represents the total length of each repeat class (in base pairs) in the M25 data set.


