
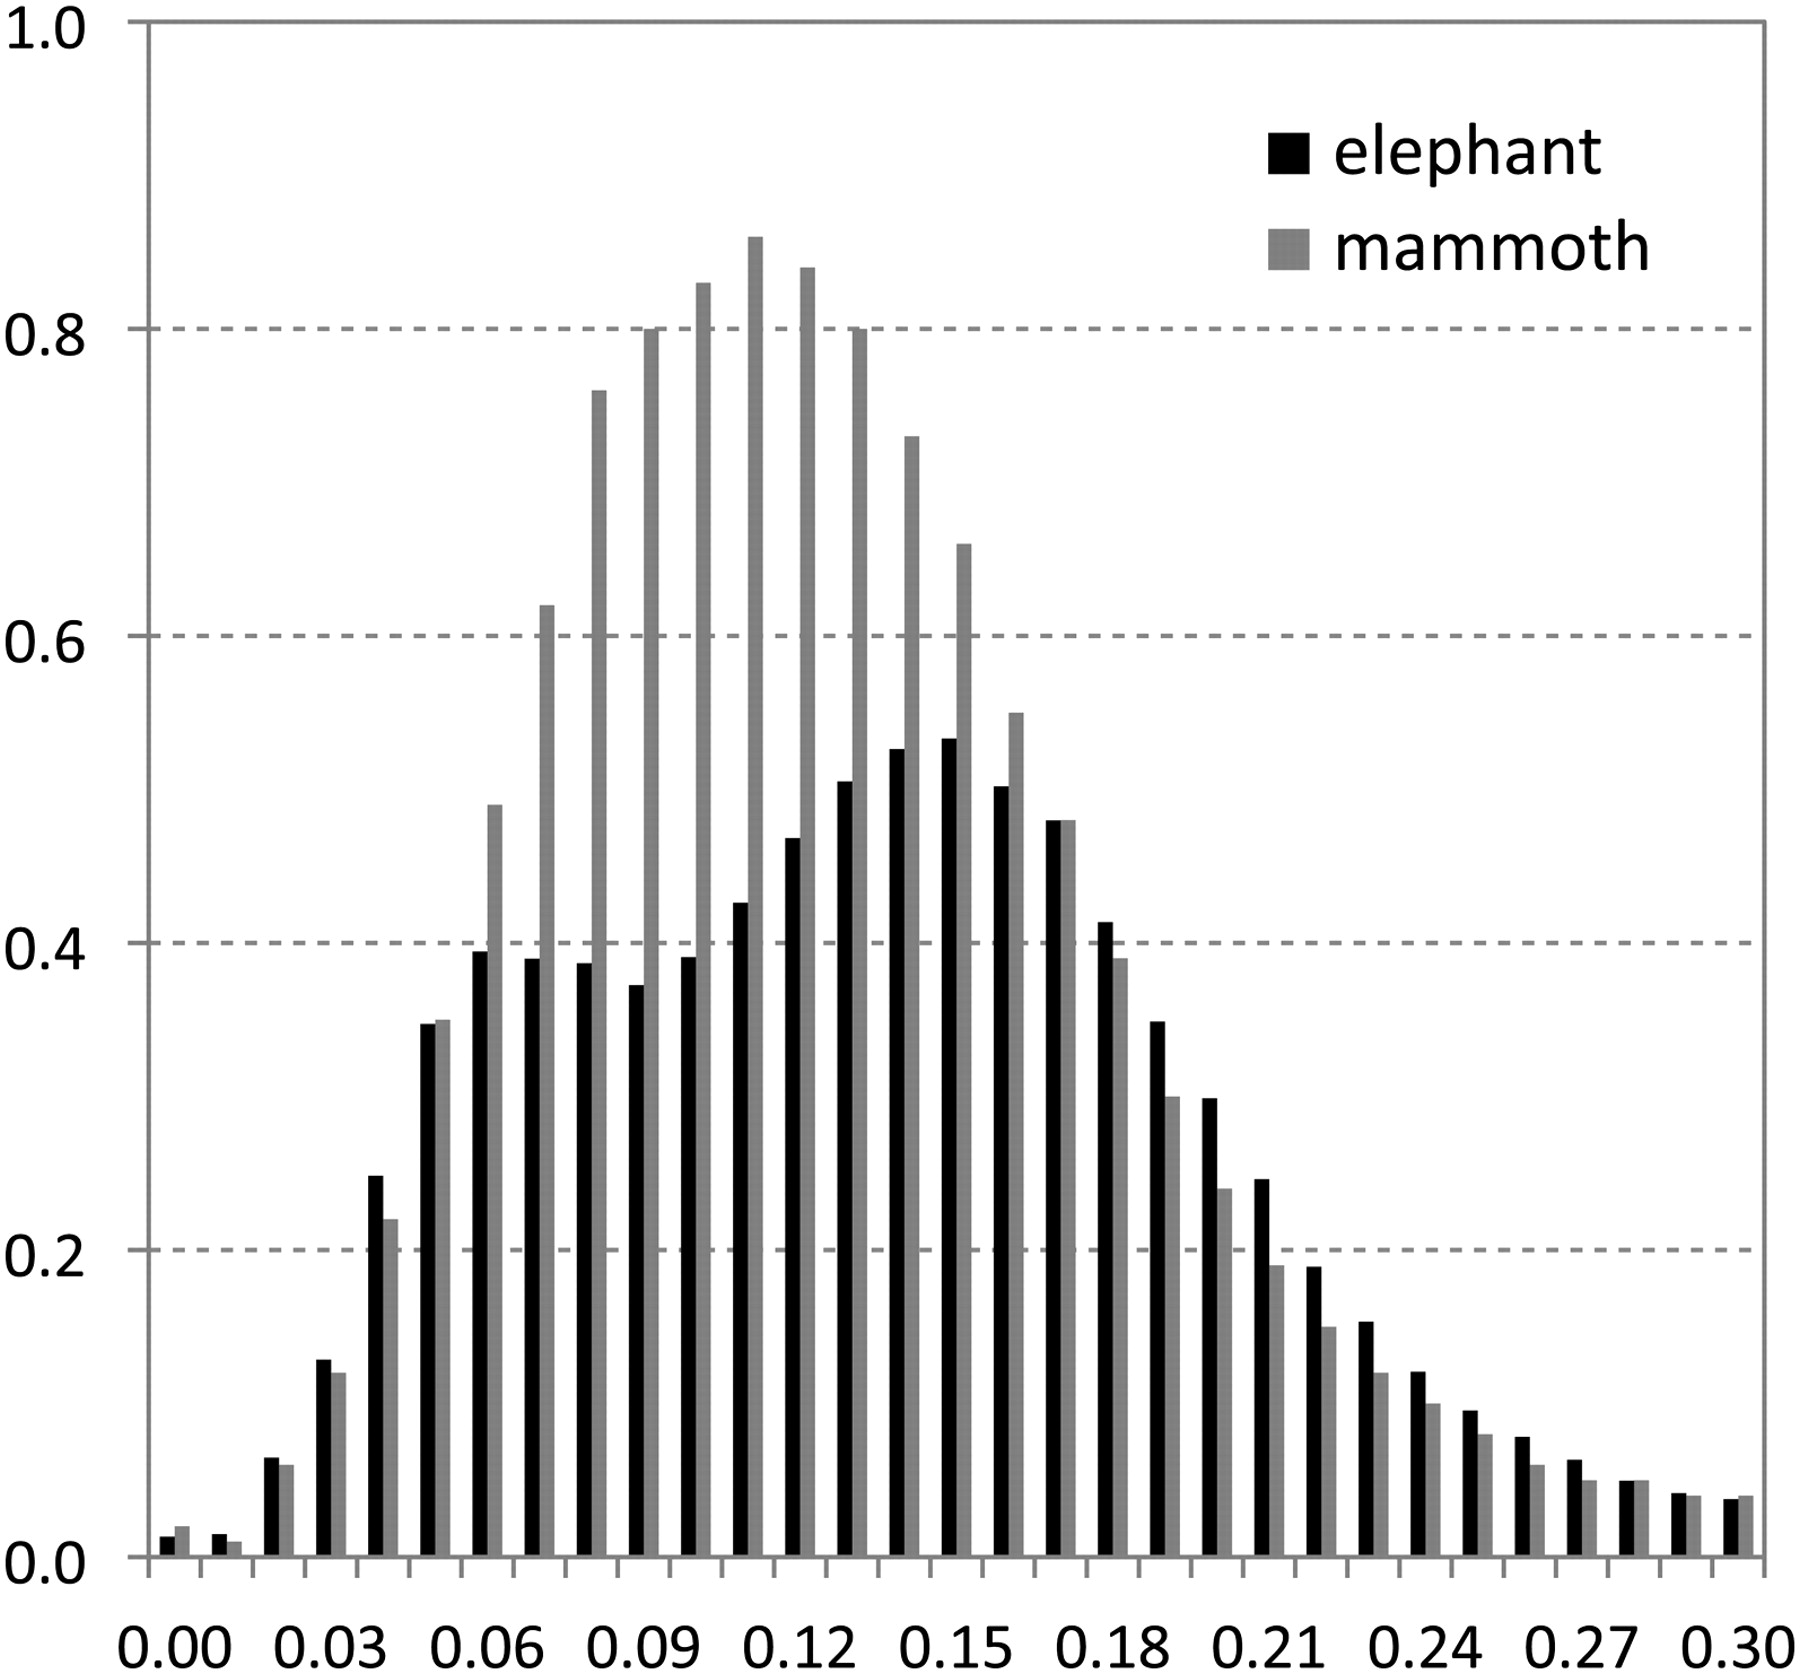
Figure 4.
Comparison of the age distributions of RTE elements in mammoth and elephant. The x-axis represents the substitution rate from the RTE consensus. The y-axis represents the fraction of the genome comprised by RTEs (in percent).


