
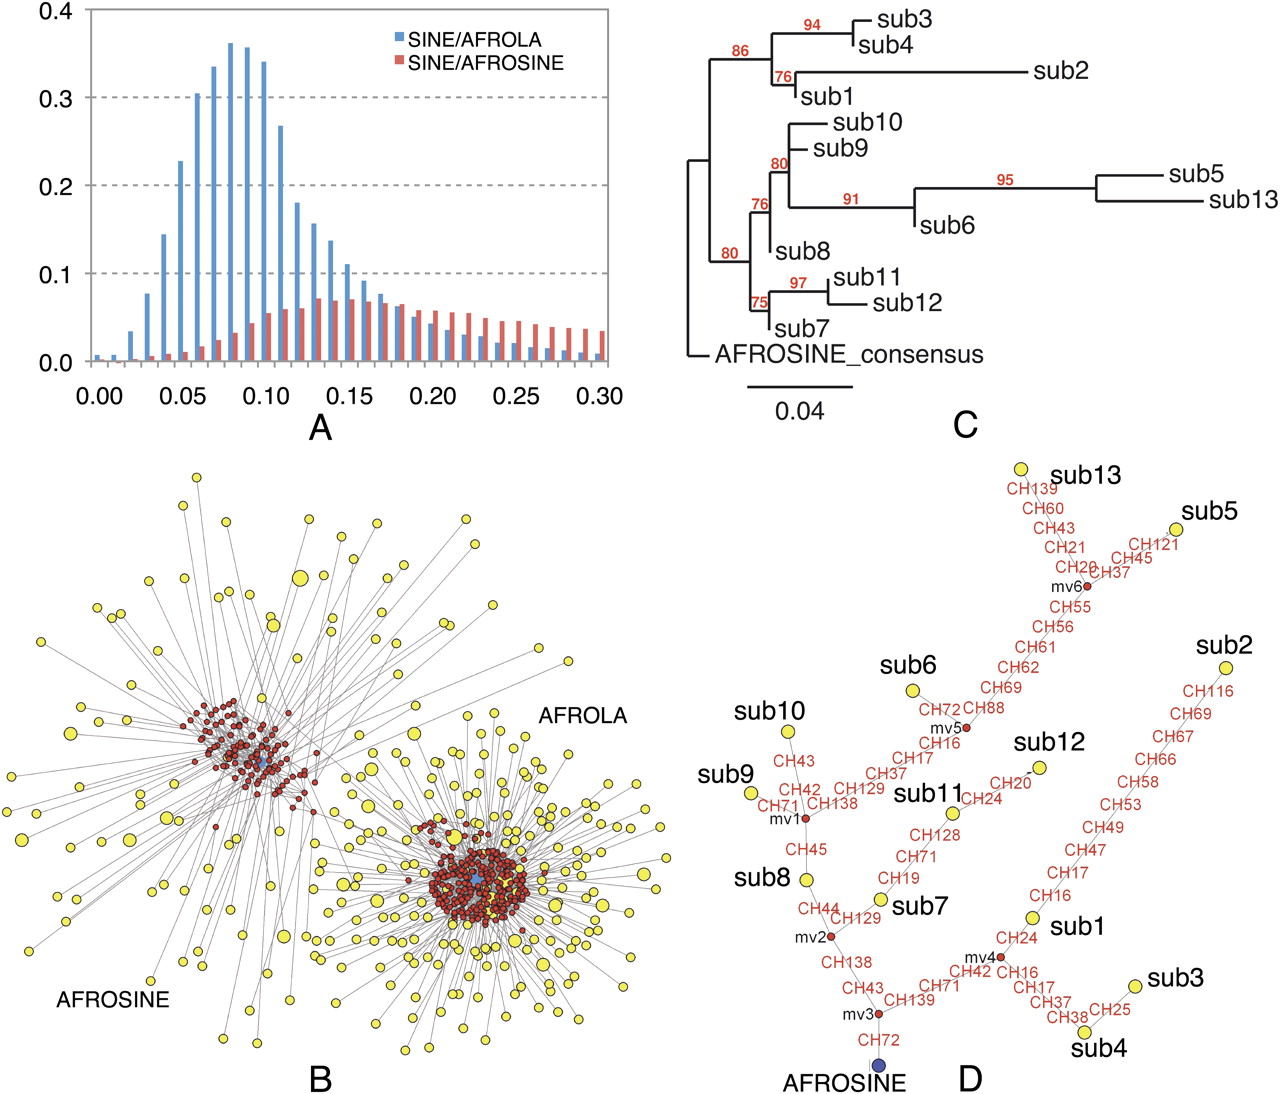
Distinct evolutionary patterns between AFROSINE and AFROLA in the mammoth genome. (A) Comparison of the age distributions of two SINE subfamilies. The x-axis represents the percent substitution from consensus sequences. The y-axis represents the fraction of the genome comprised by repeat class (in percent). (B) A median-joining network of two SINE subfamilies. The network was constructed with randomly selected SINE sequences from the M25 data set. (Yellow circles) SINEs; (red circles) the reconstructed nodes; (blue circles) the consensus sequences of two SINE subfamilies. The size of the circle is proportional to the number of sequences. (Lines) Substitutions. (C) A phylogenetic tree of the consensus sequences of different subgroups of AFROSINEs, as described in Methods. (Red) Bootstrap values. (D) Phylogenetic network of the consensus sequences used in C. The legends are the same as those in B. Nucleotide mutations are labeled in red along each line.


