
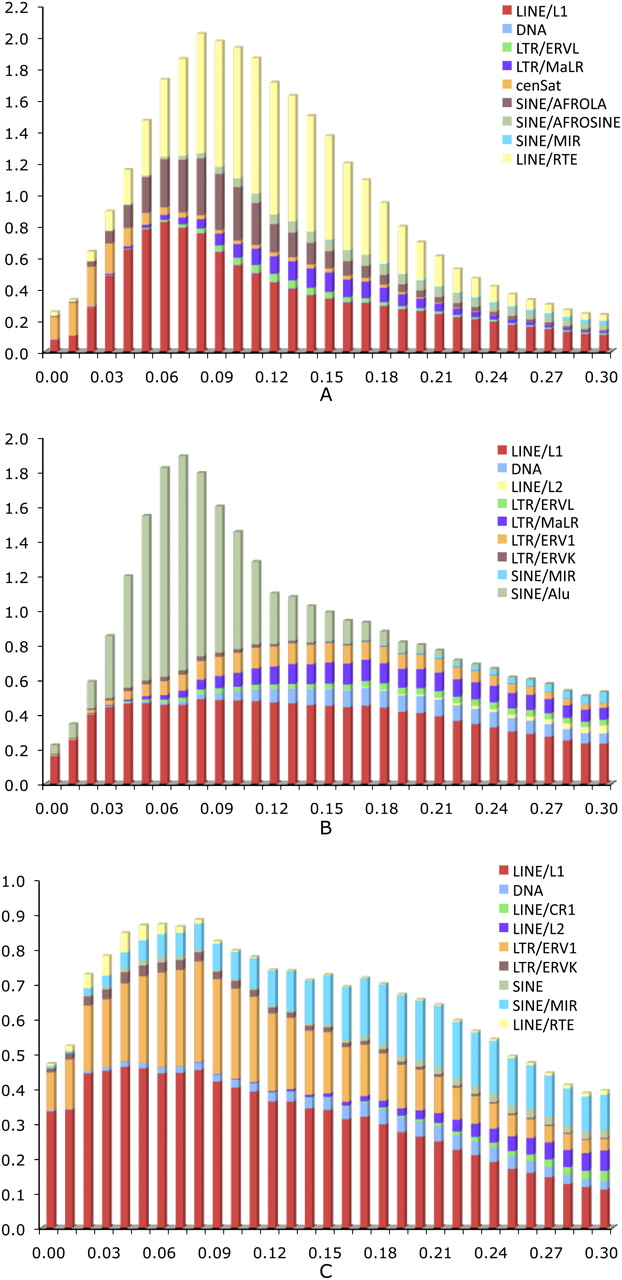
Figure 1.
Age distribution of interspersed repeats in the mammoth (A), human (B), and opossum (C) genomes. The x-axis represents the substitution rate from consensus sequences. The y-axis represents the fraction of the genome comprised by repeat class (%). Note that the age distributions of interspersed repeats for human and opossum were based on the simulated data sets.


