
Table 1.
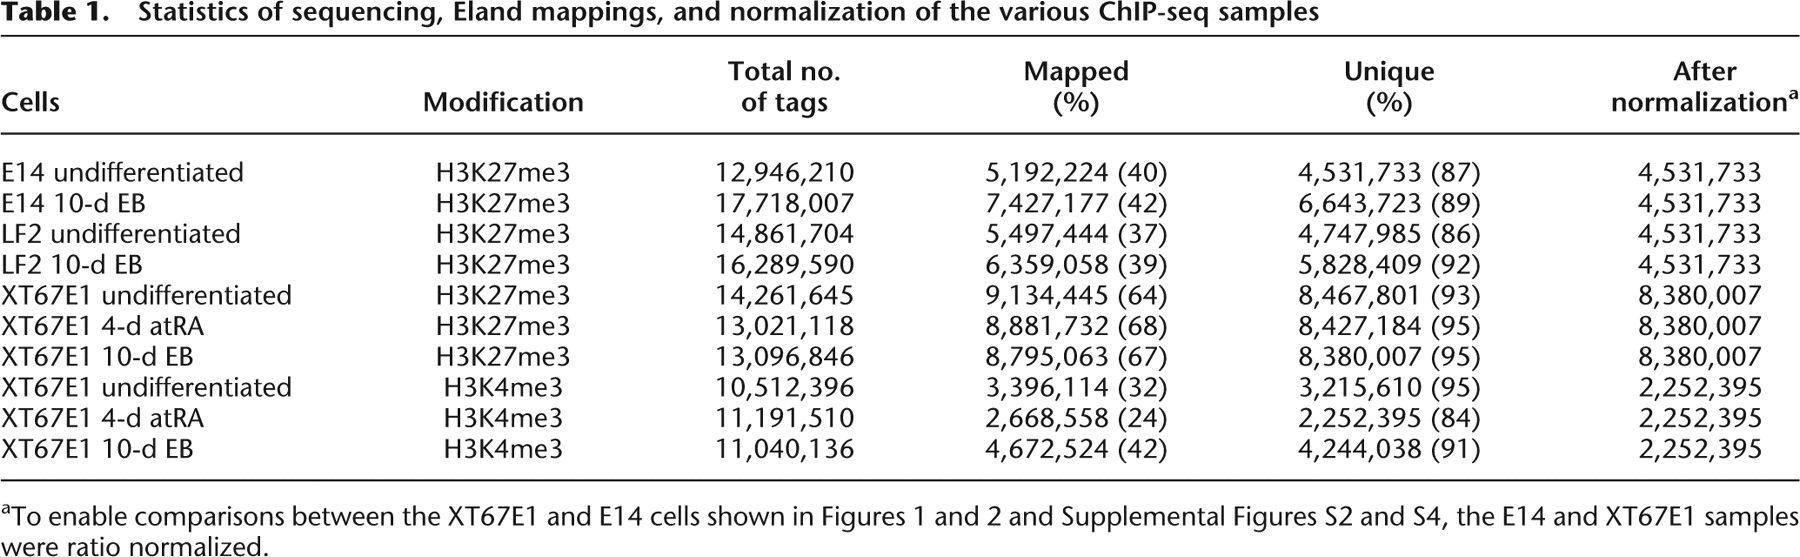
Statistics of sequencing, Eland mappings, and normalization of the various ChIP-seq samples
Click on table to view larger version.
-
aTo enable comparisons between the XT67E1 and E14 cells shown in Figures 1 and 2 and Supplemental Figures S2 and S4, the E14 and XT67E1 samples were ratio normalized.


