
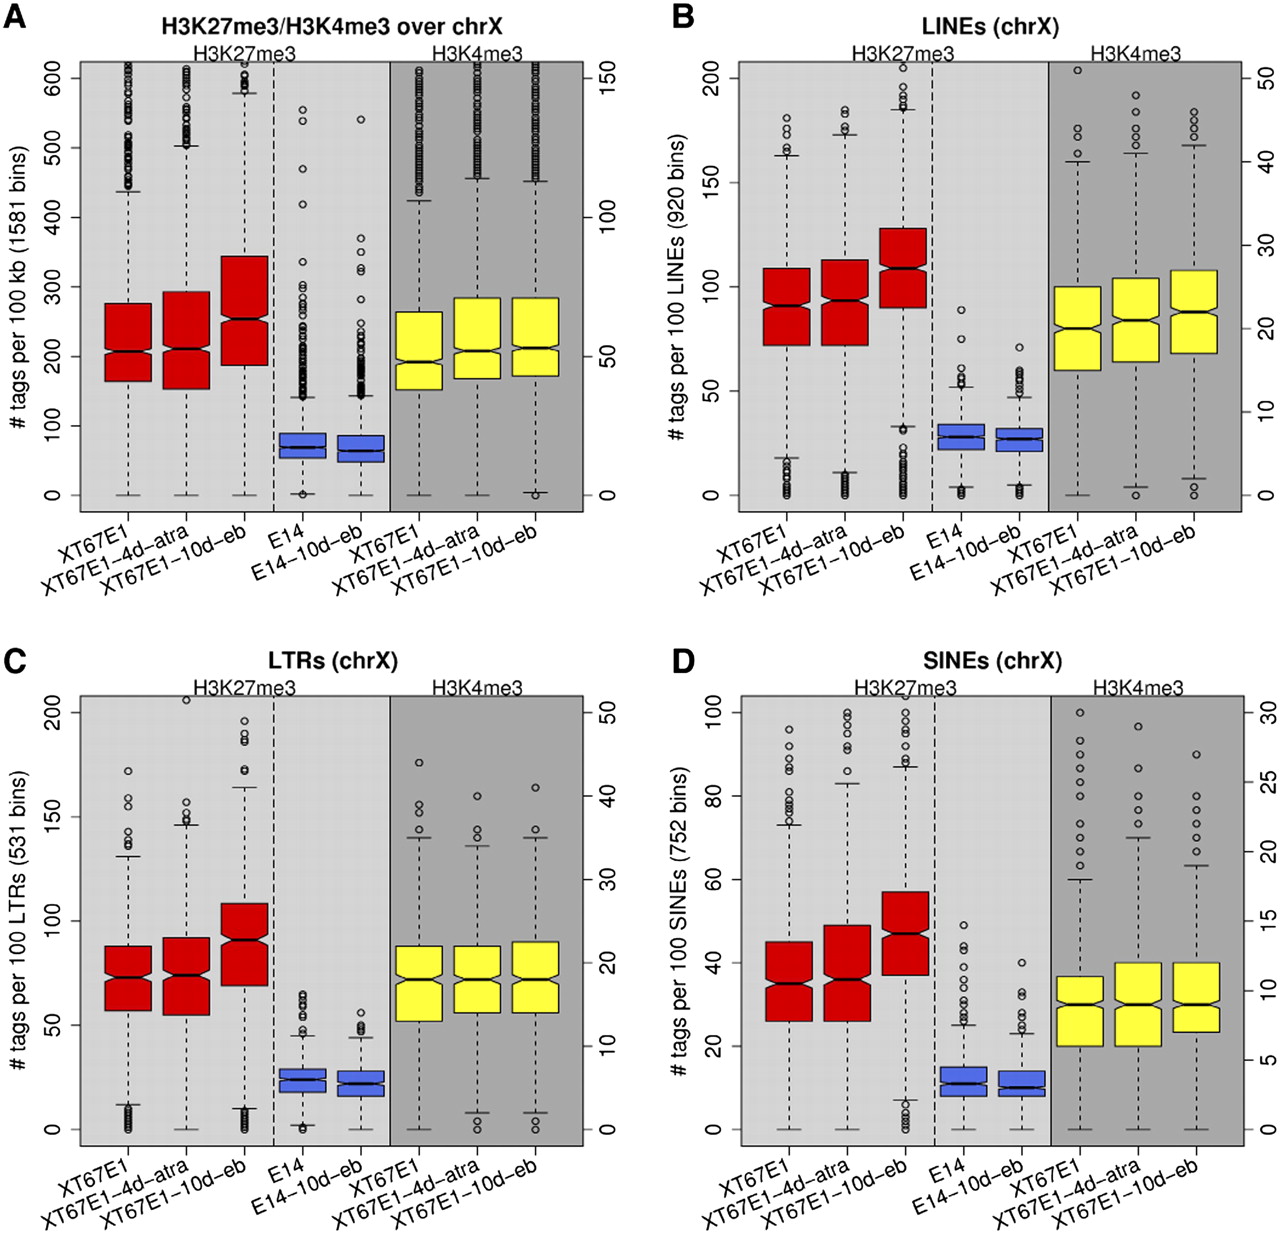
Figure 6.
Boxplots of the occupancies of H3K27me3 and H3K4me3 over various repeats of chromosome X in female XT67E1 and male E14 cells. (A) All tags on chromosome X; a boxplot representation of the graphs shown in Fig. 5A. (B–D) Distributions over various repeat classes (LINE, LTR, and SINE repeats).


