
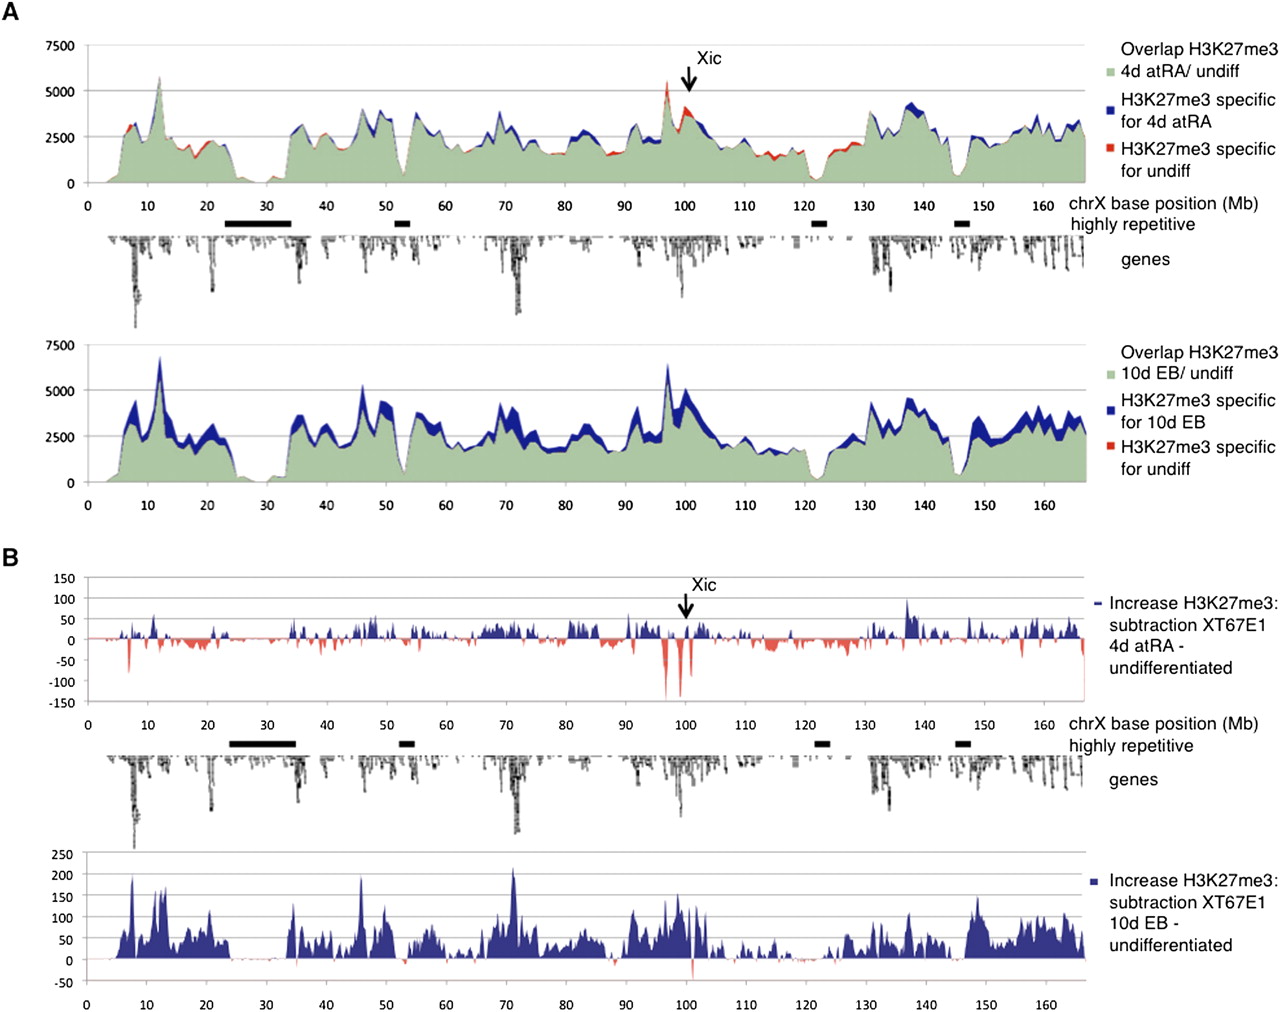
Figure 5.
Kinetics of H3K27me3 over chromosome X during XCI in XT67E1 cells, showing a chromosome-wide increase of H3K27me3 during XCI. (A) H3K27me3 profiles over chromosome X in XT67E1 cells. Chromosome X is subdivided in bins of 1 Mb, followed by counting of the number of tags per bin. undiff, undifferentiated. (B) Subtraction tracks of the H3K27me3 profiles shown in A at a higher resolution (bins of 100 kb). Increase of H3K27me3 as compared to undifferentiated cells is indicated in blue, decrease in red.


