
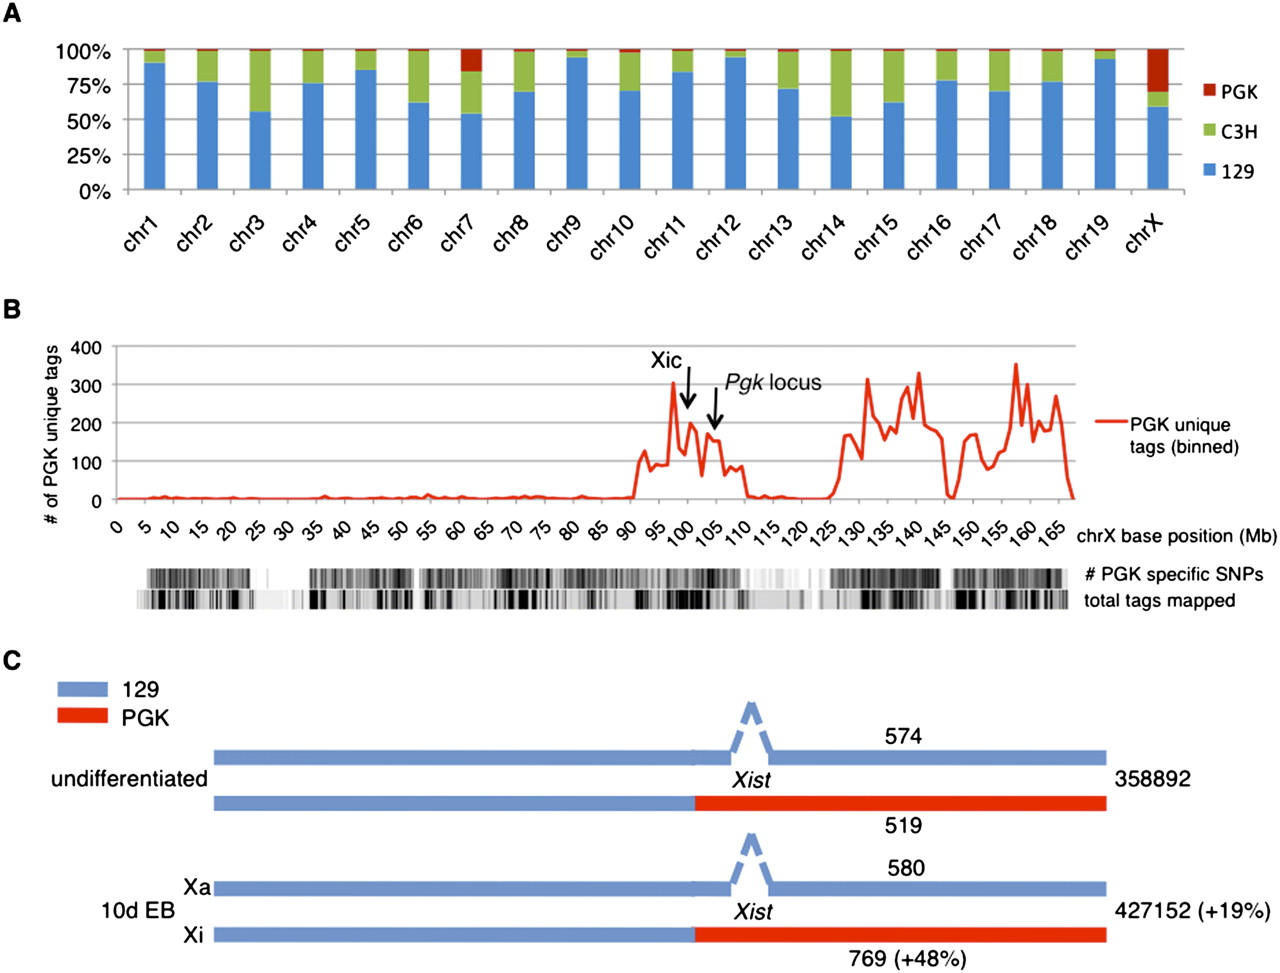
Allele-specific mapping of tags obtained during the ChIP-seq experiments. (A) Genetic make-up of XT67E1 mouse ES cells, showing the contribution of the parental PGK, C3H, or 129 mouse strains to the individual chromosomes of the XT67E1 cells. For individual chromosomes, the contribution of each strain was calculated by dividing the number of uniquely identified SNPs in the ChIP-seq experiments by the total number of SNPs, as determined from the SNP database (mouse.perlegen.com/mouse/index.html). (B) Distribution of the uniquely identified PGK SNPs within the total pool of XT67E1 ChIP-seq tags in 1 Mb bins over the X chromosome (represented by the x-axis). Density plots of the total number of PGK-specific SNPs (114,781 for the complete X chromosome), as well as of the total number of mapped tags, are plotted below the graph. The genomic locations of the Xic and the Pgk locus are indicated. (C) Schematic representation of the X chromosomes in the undifferentiated and the 10-d EB XT67E1 cells, with the Xist deletion in the 129 derived X chromosome (which will become the Xa during XCI). The number of total H3K27me3 tags mapped over both chromosomes, as well as the number of tags that could be mapped allele-specific, is indicated for both stages.


