
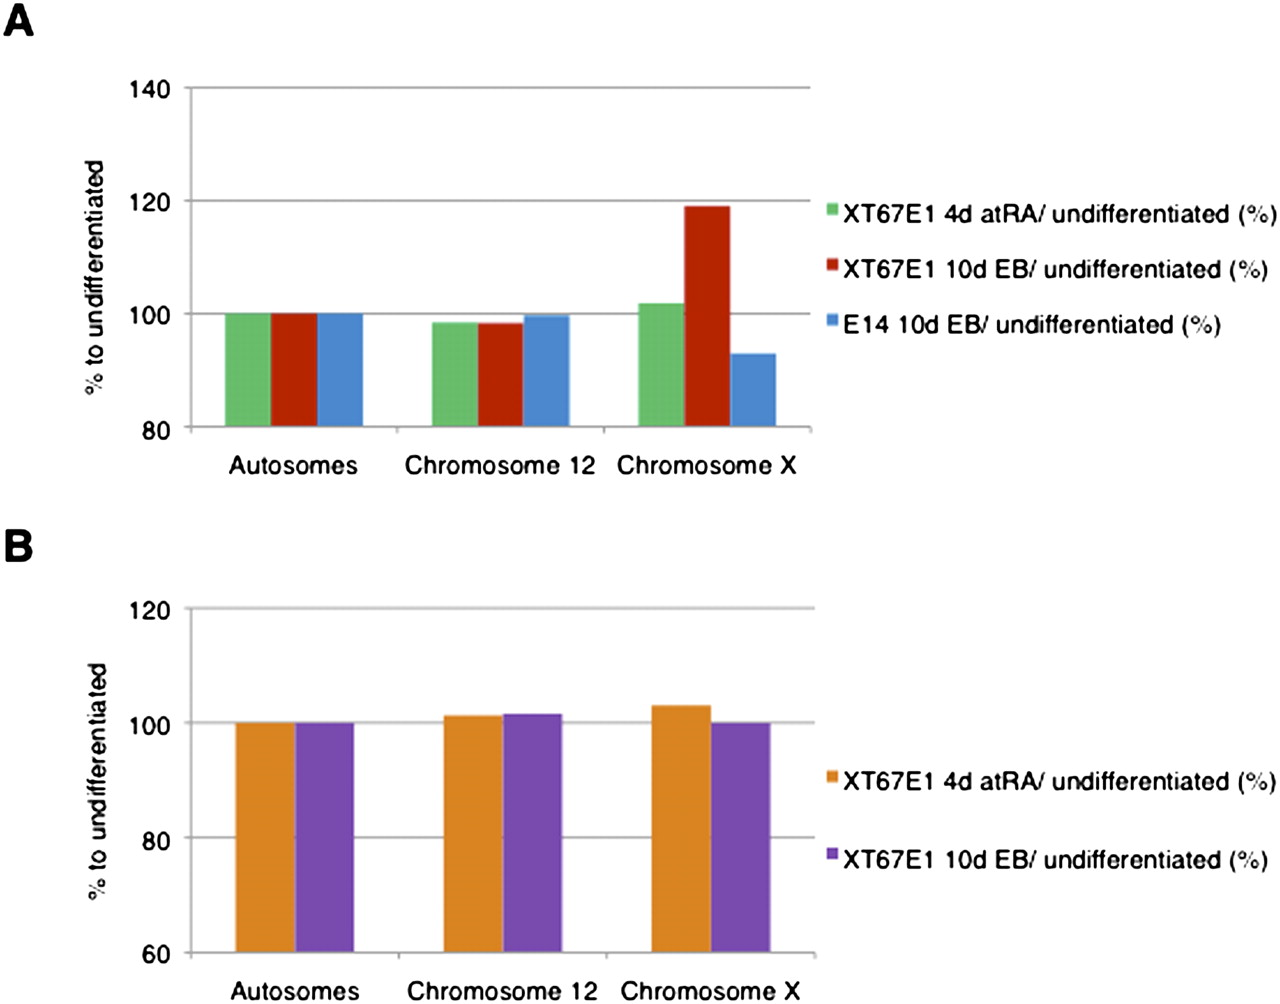
Specific enrichment of H3K27me3 on the X chromosome after 10-d EB formation in mouse female XT67E1 ES cells, but not in male ES cells. (A) H3K27me3 tag distribution (representing amounts of H3K27me3) over autosomes or the X chromosome in XT67E1 or E14 cells (ratio of 4-d atRA or 10-d EB versus undifferentiated cells in percent). See Supplemental material and Supplemental Figure S7 for more details. (B) H3K4me3 tag distribution (representing amounts of H3K4me3) over autosomes or the X chromosome in XT67E1 cells (ratio of 4-d atRA or 10-d EB versus undifferentiated cells in percent). See Supplemental material and Supplemental Figure S7 for more details.


