
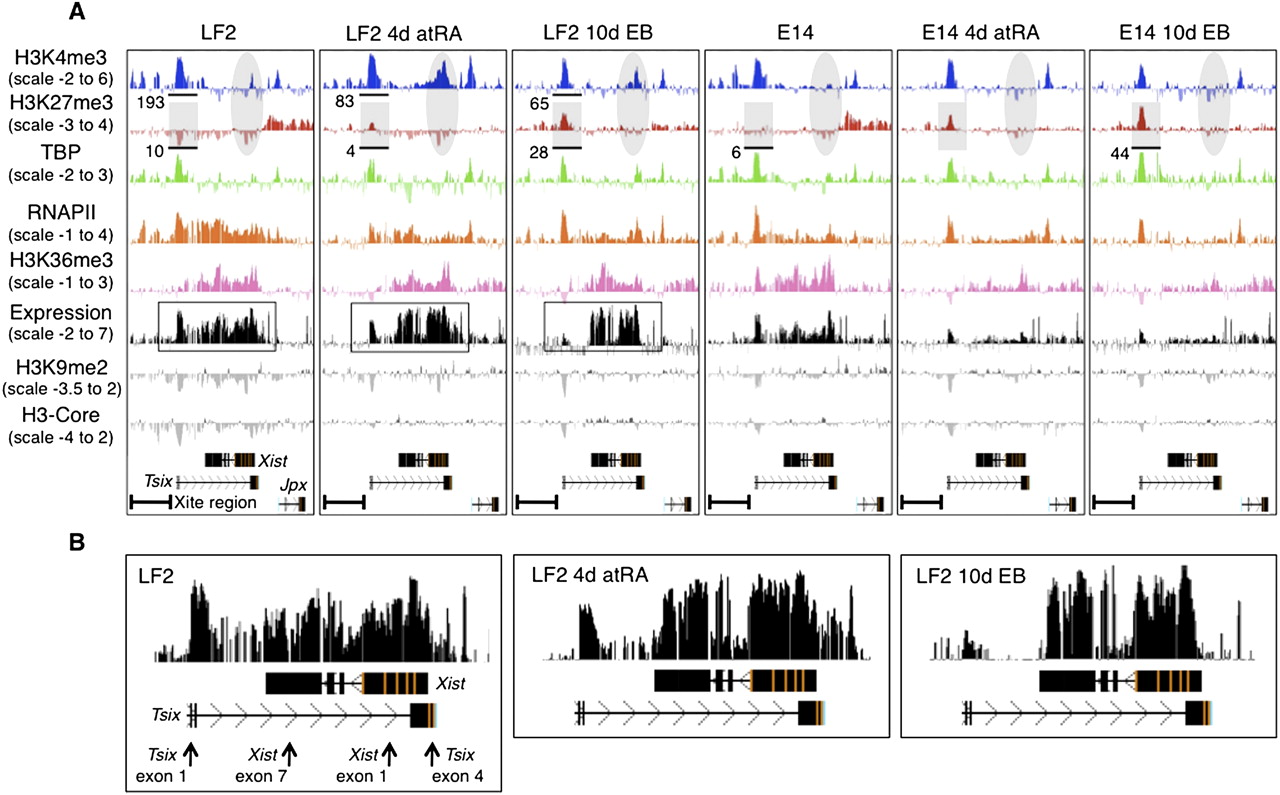
Overview of the epigenetic landscape, as well as gene expression within and centered around the Xic. A screen shot from the UCSC Genome Browser showing the distribution of the ChIP-chip profiles across a 100 kb region of mouse chromosome X in mouse embryonic cells (UCSC Mouse [mm9], July 2007; chromosome X genomic coordinates 100.615–100.715 Mb). Expression was determined by hybridizing polyA RNA to the tiling array. Y-axis, log2 ChIP/input ratio or log2 cDNA/input ratio; x-axis, 50 bp oligonucleotides from sequence included on the NimbleGen mouse chromosome X tiling array. The quantification, as shown below the profiles, was obtained from the XT67E1 ChIP-seq experiments as described later. For quantifications, ChIP-seq tags were counted within the indicated regions. For the E14 cells, the tags are obtained from one X chromosome, while in XT67E1 cells they are obtained from both X chromosomes. (A) Overview of the Tsix–Xist interplay. Tsix and Xist noncoding RNAs, and direction of transcription, are indicated below all profiles. (B) Enlargement of the expression profiles of the LF2 cells, showing a clear correlation between the expression signal and the Xist exons after 4-d atRA treatment or 10-d EB formation. The arrows shown for the undifferentiated LF2 cells indicate PCR amplicons used for RT-qPCR validation (Supplemental Fig. S1b).


