
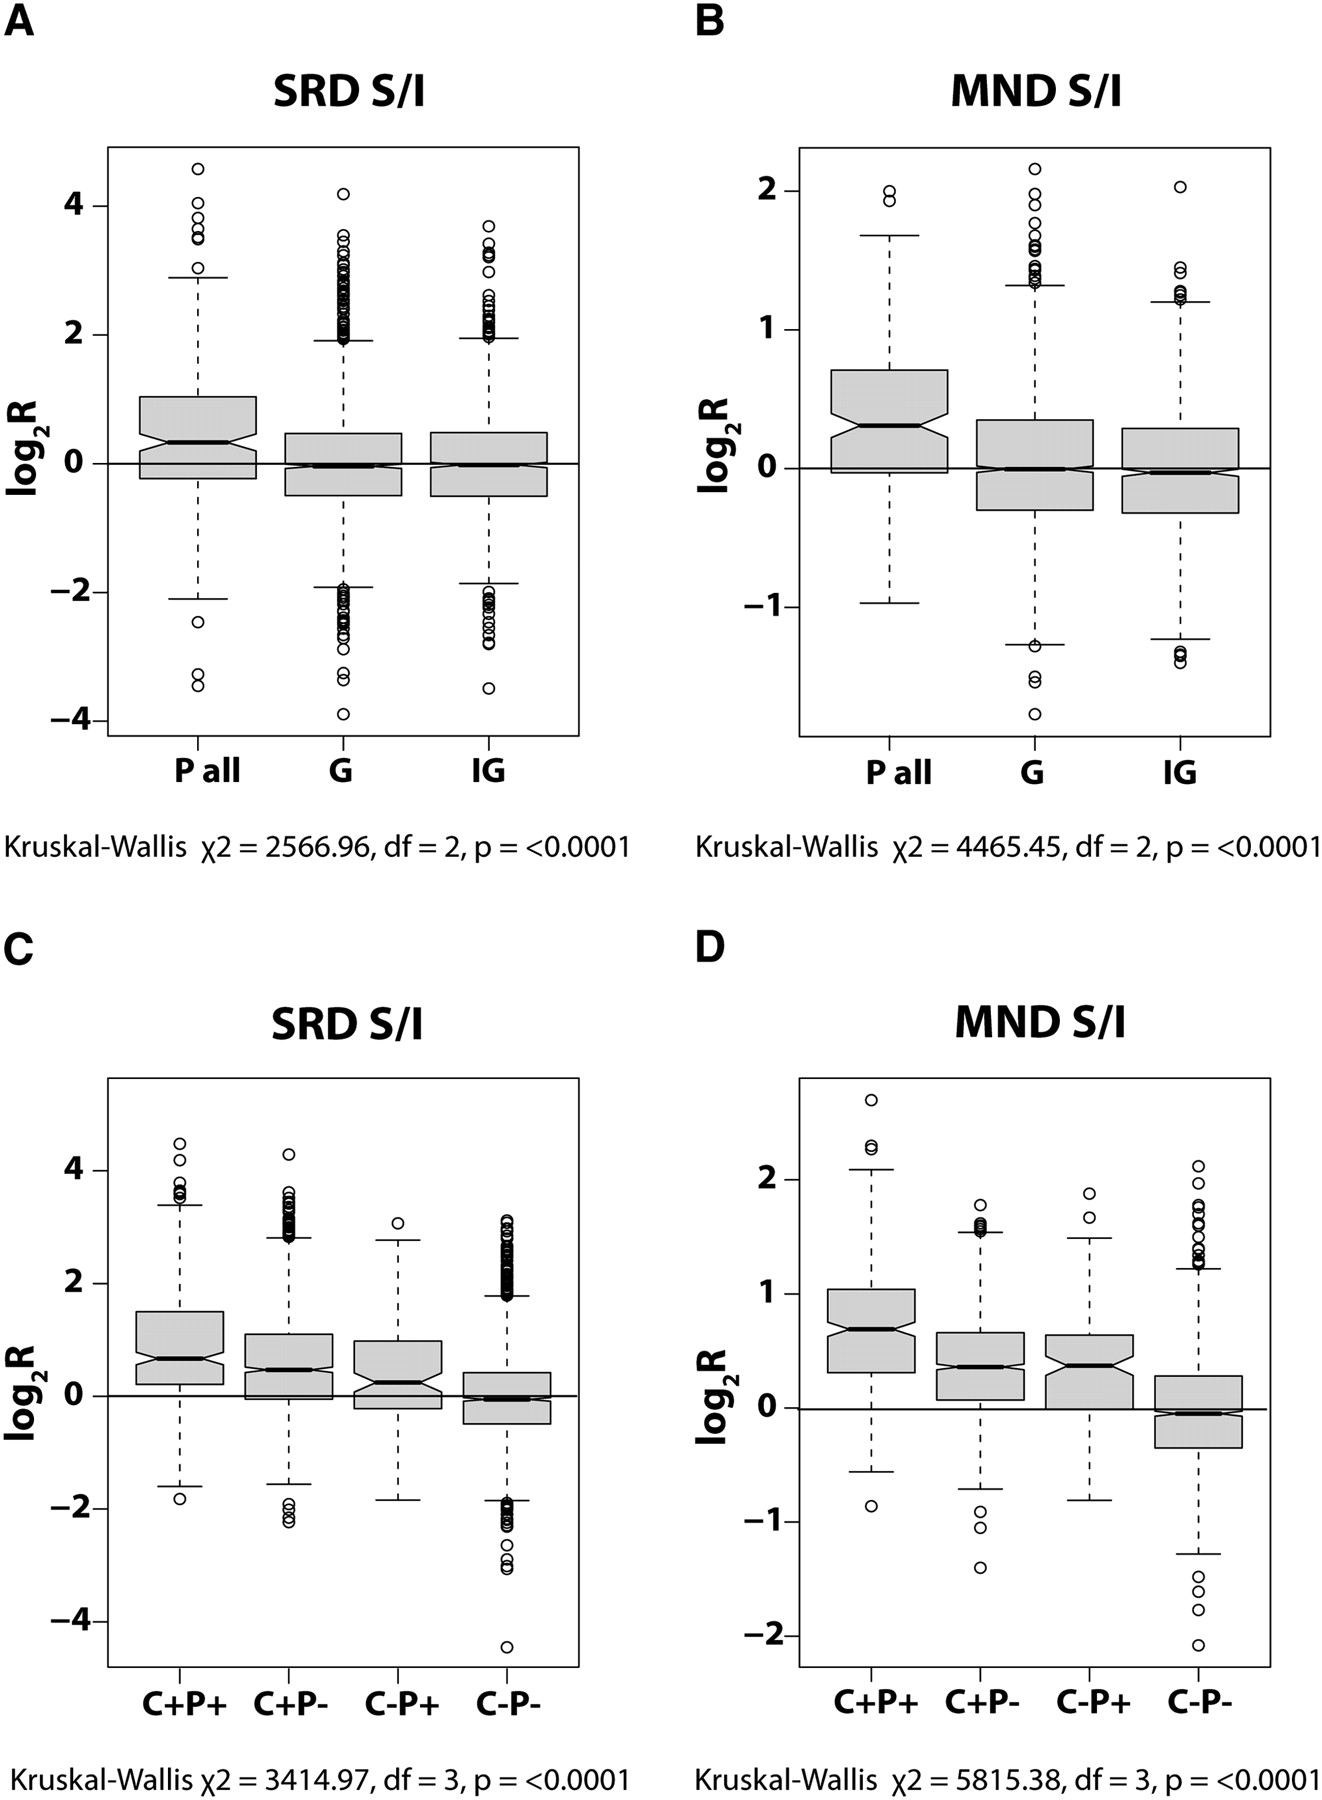
Gene regulatory sequences in MND and SRD fractions. Boxplots showing the partitioning behavior of sequences detected by all probes located within promoters (P all) in the SRD (A) and MND (B) fractions compared with those within genic (G) and intergenic (IG) sequences. The partitioning behavior of sequences detected by probes within CTCF clusters in association with (C+P+) or without (C+P−) promoters is shown for SRD (C) and MND (D) fractions compared with the behavior of promoters alone (C−P+; equivalent to “P all” in A and B) or the absence of both promoters and CTCF clusters (C−P−; equivalent to G/IG in A and B). The center of the boxes indicates the median value with the first and third quartiles drawn on either side. Notches indicate significant differences in median values (Tukey's honest significance difference). In all plots, log2R values >0 indicate solubility and <0 indicate insolubility. Note that the greatest skew toward solubility is for probes detecting sequences located within promoters and CTCF clusters, followed by probes with CTCF clusters alone, and then within promoters alone.


