
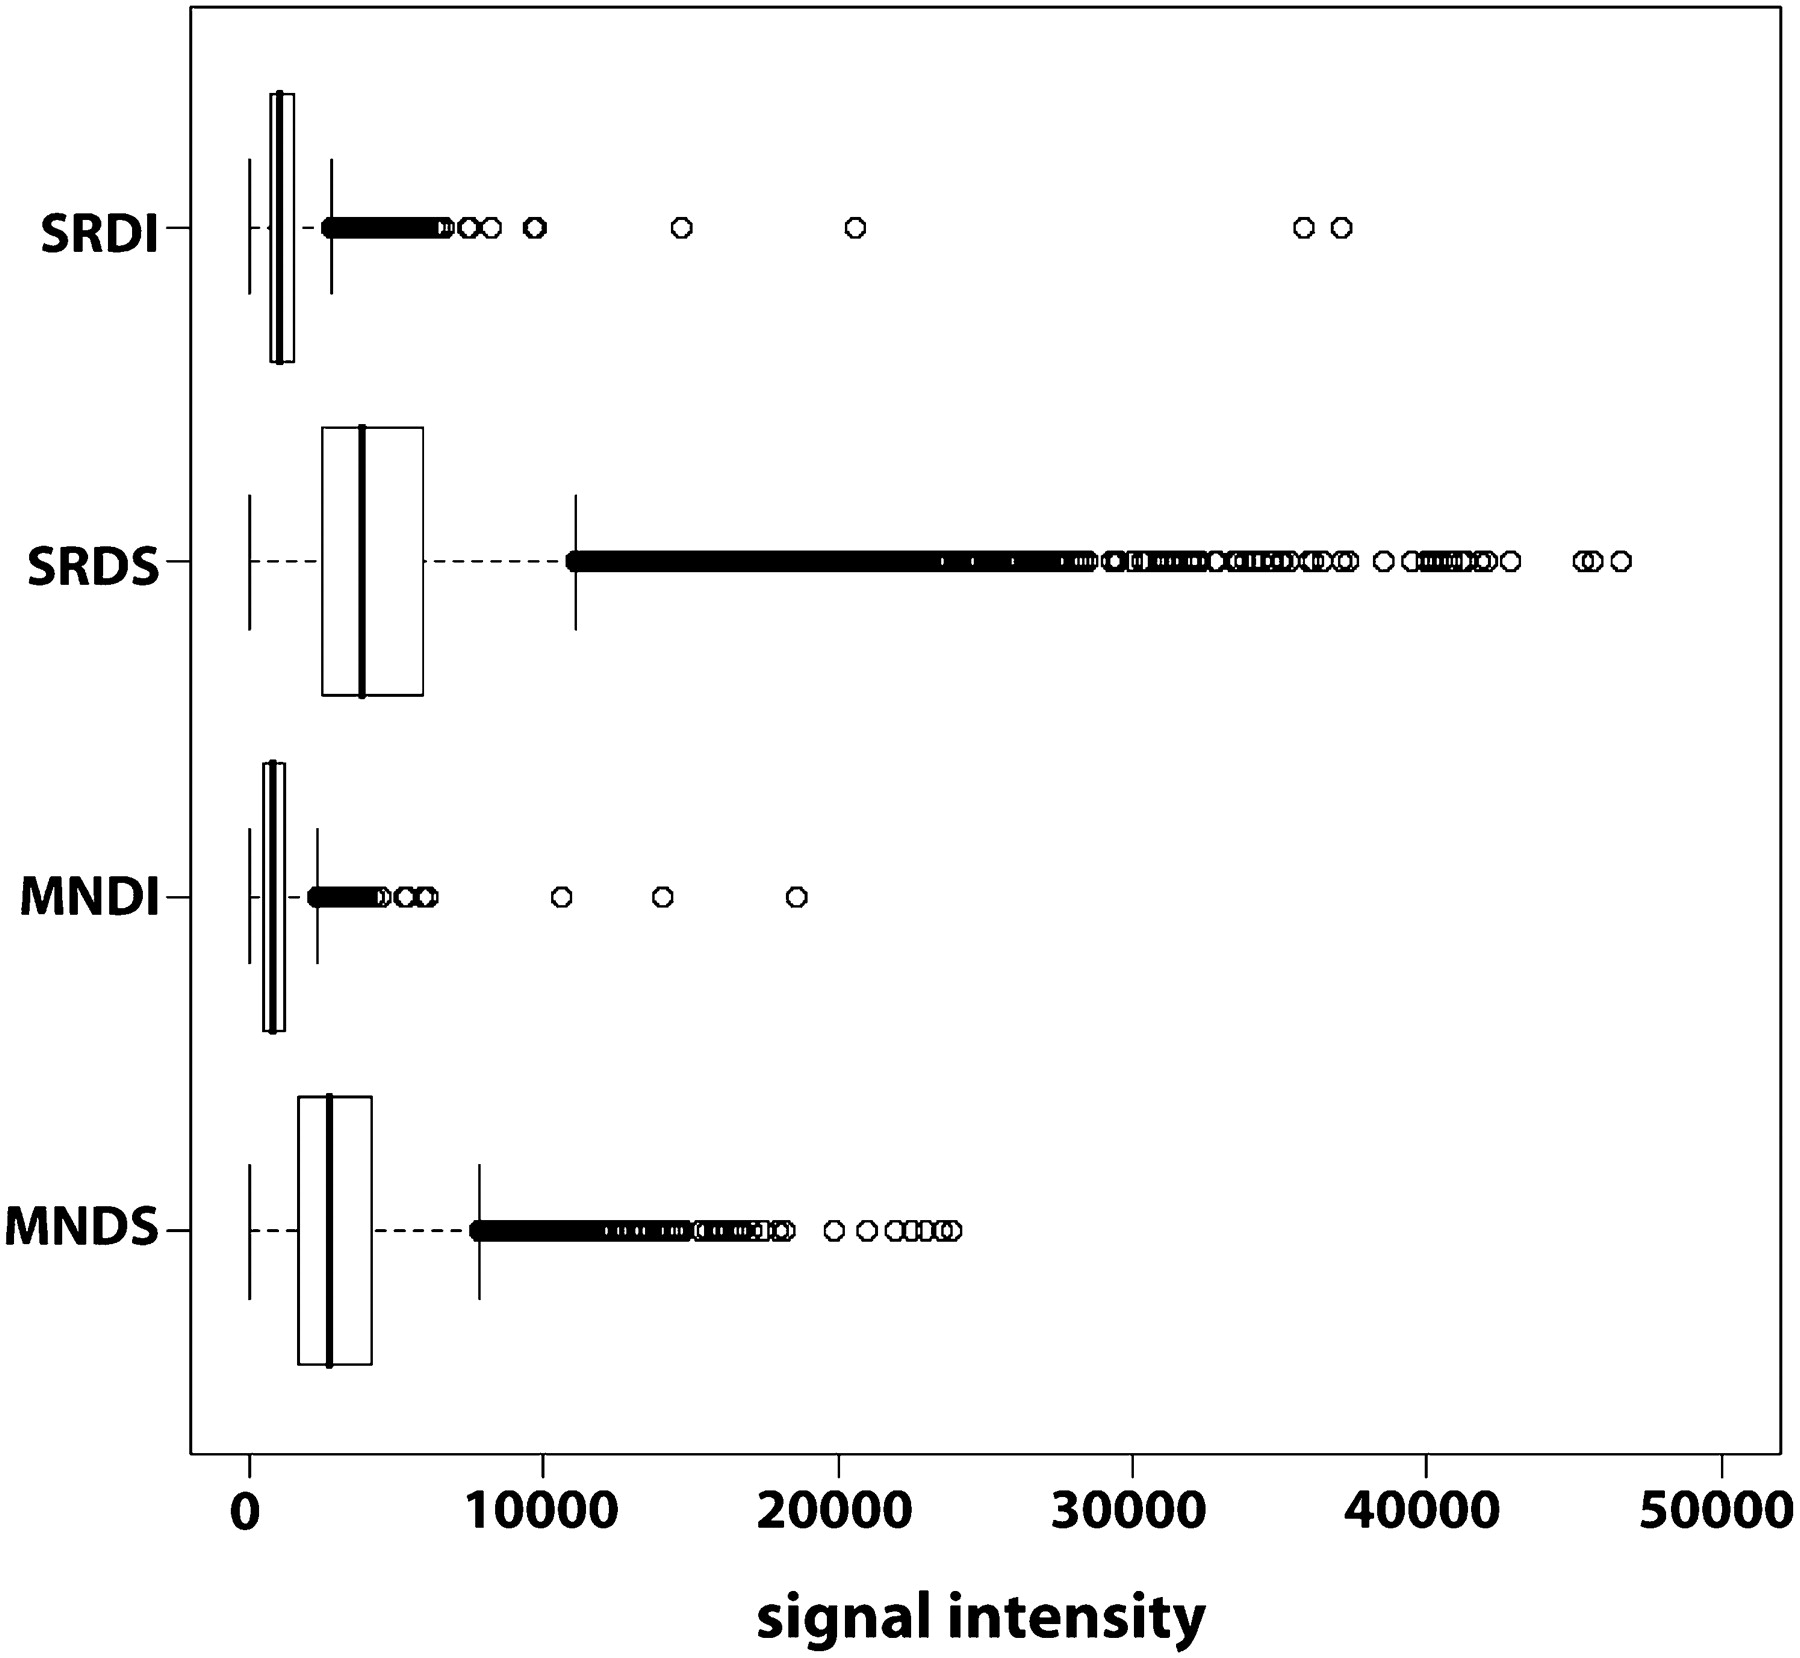
Figure 4.
Probe signal intensities from MND and SRD fractions. Boxplots showing the range for all probes in all fractions with at least a twofold change in probe signal intensity from the median value (black bars). The plots show clearly that the highest numbers of high signal intensities are in the soluble fractions.


