
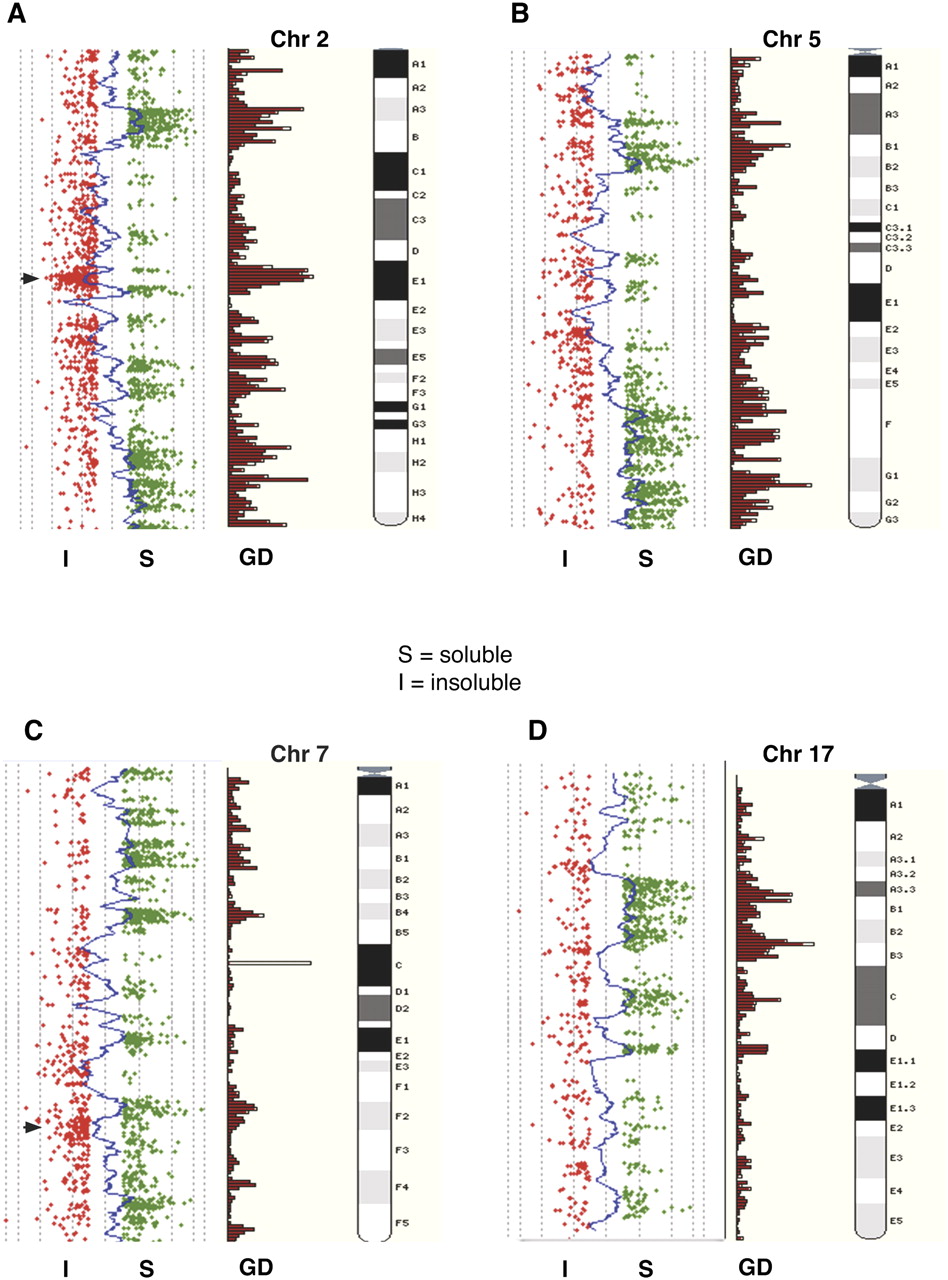
Whole chromosome CGH scatterplots (mouse). The log2R moving averages from murine MNDS/MNDI data generated on the Agilent mouse 244K CGH platform are shown for chromosome 2, chromosome 5 (B), chromosome 7 (C), and chromosome 17 (D). The probe profiles from MNDS/MNDI fractions as individual log2R values >0.5; (green) soluble (S); (red) ≤0.5 insoluble (I) are aligned alongside Ensembl gene density profiles and chromosome ideograms. As with the human data, the tendency for the MNDS probes to correspond closely with gene density profiles is evident. (Arrowhead) A prominent olfactory receptor gene cluster on chromosome 2 where this trend (as in human sperm chromatin) is reversed.


