
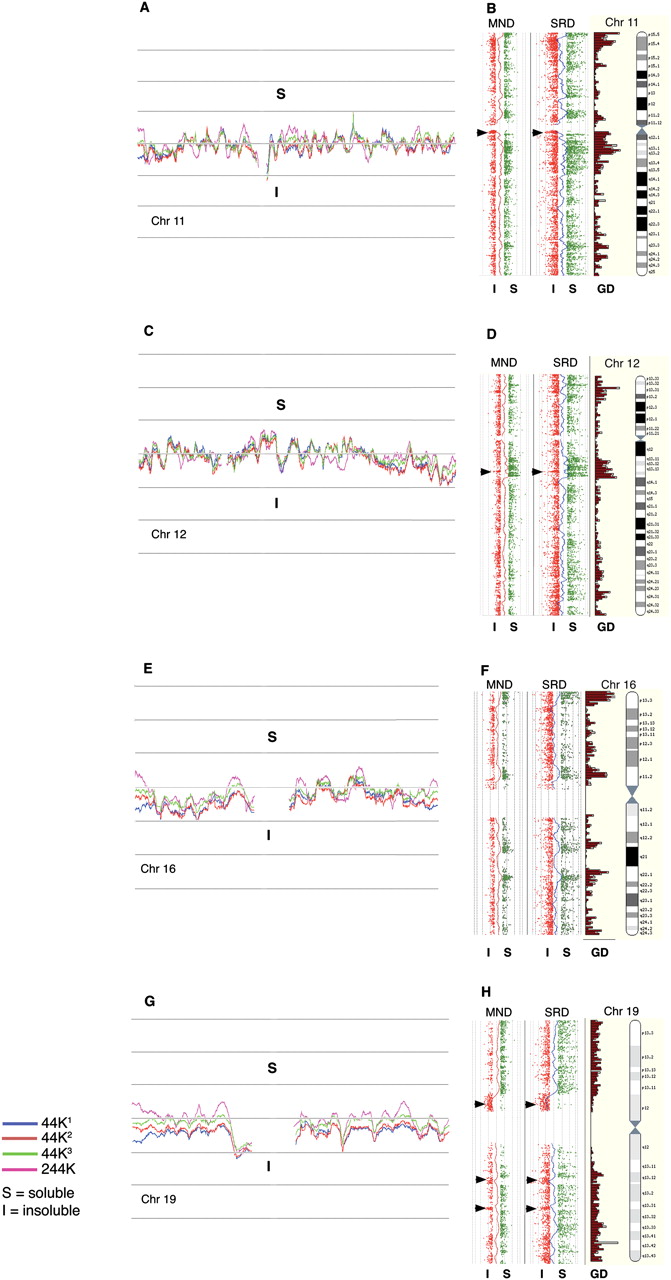
Whole chromosome CGH plots (human). (A,C,E,G) The log2R moving average profiles obtained from the 44K CGH analysis of SRDS/SRDI fraction pairs of three individual men (44K1, 44K2, and 44K3) for chromosomes 11, 12, 16, and 19. The moving average profile from an additional fraction pair analyzed on the 244K CGH platform is also shown. (B,D,F,H) The 244K probe plots from SRDS/SRDI and MNDS/MNDI data as individual log2R values >0.5; (green) soluble (S); (red) ≤0.5 insoluble (I) fractions aligned alongside Ensembl gene density profiles and chromosome ideograms (http://www.ensembl.org). Moving average traces that are dynamically equivalent to those drawn in panels A, C, E, and G are drawn between the fraction pairs. (Arrowheads) Olfactory receptor gene clusters on chromosomes 11 and 12 and zinc finger clusters on chromosome 19. With the exception of these cluster types, the tendency for the SRDS/MNDS probes to correspond closely with gene density profiles is clearly evident.


