
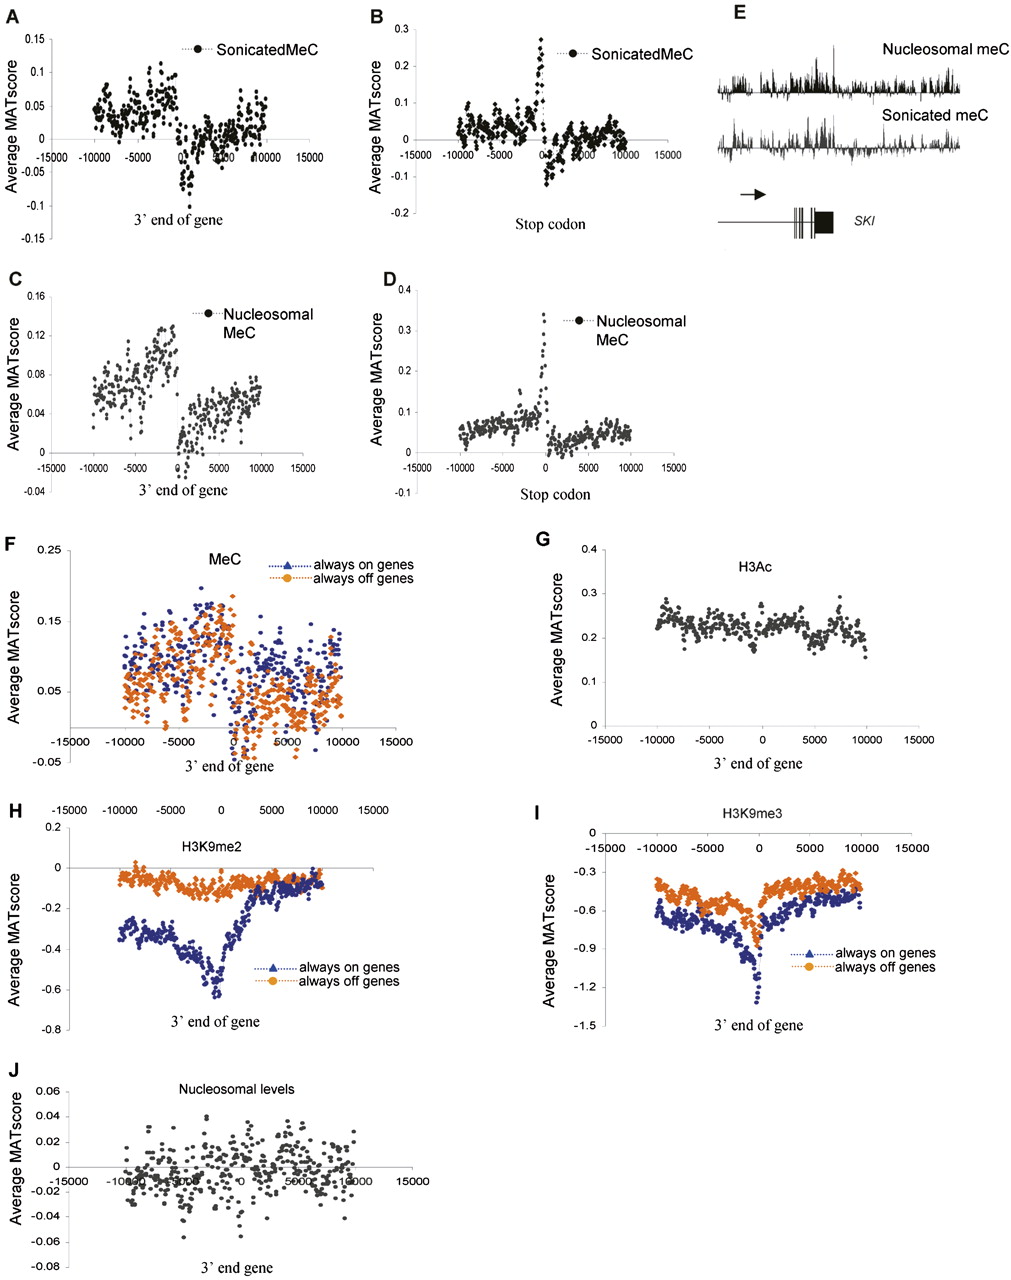
Epigenetic patterns at the 3′ end of genes. (A,B) Average MAT score (y-axis) for meC in sonicated DNA, mapped across a 20-kb region centered on the 3′end (A) and stop codon (B) (x-axis) of 1935 chr 1 genes. (C,D) As for A and B, but for nucleosomal DNA. (E) An example of 3′ end meC (nucleosomal and sonicated) pattern for the SKI gene. (Horizontal arrow) direction of transcription. (F) Average MAT score for meC at the 3′ end of active “always on” (blue) and inactive “always off” (orange) genes on chr 1. (G) Average MAT score (y-axis) for H3Ac across a 20-kb region centered on the 3′ end of the gene (x-axis) for 1935 chr 1 genes in quiescent T cells. (H) Average MAT score for the inactive histone mark H3K9me2 in quiescent T cells plotted according to expression and centered around the 3′ end of chr 1 genes. (Blue) Average values of active “always on” genes, (orange) inactive “always off” genes. (I) As for H, but for the H3K9me3 modification. (J) Average relative nucleosome levels (MAT score) aligned with respect to the 3′ end of 1935 chr 1 genes over 20 kb in quiescent T cells.


