
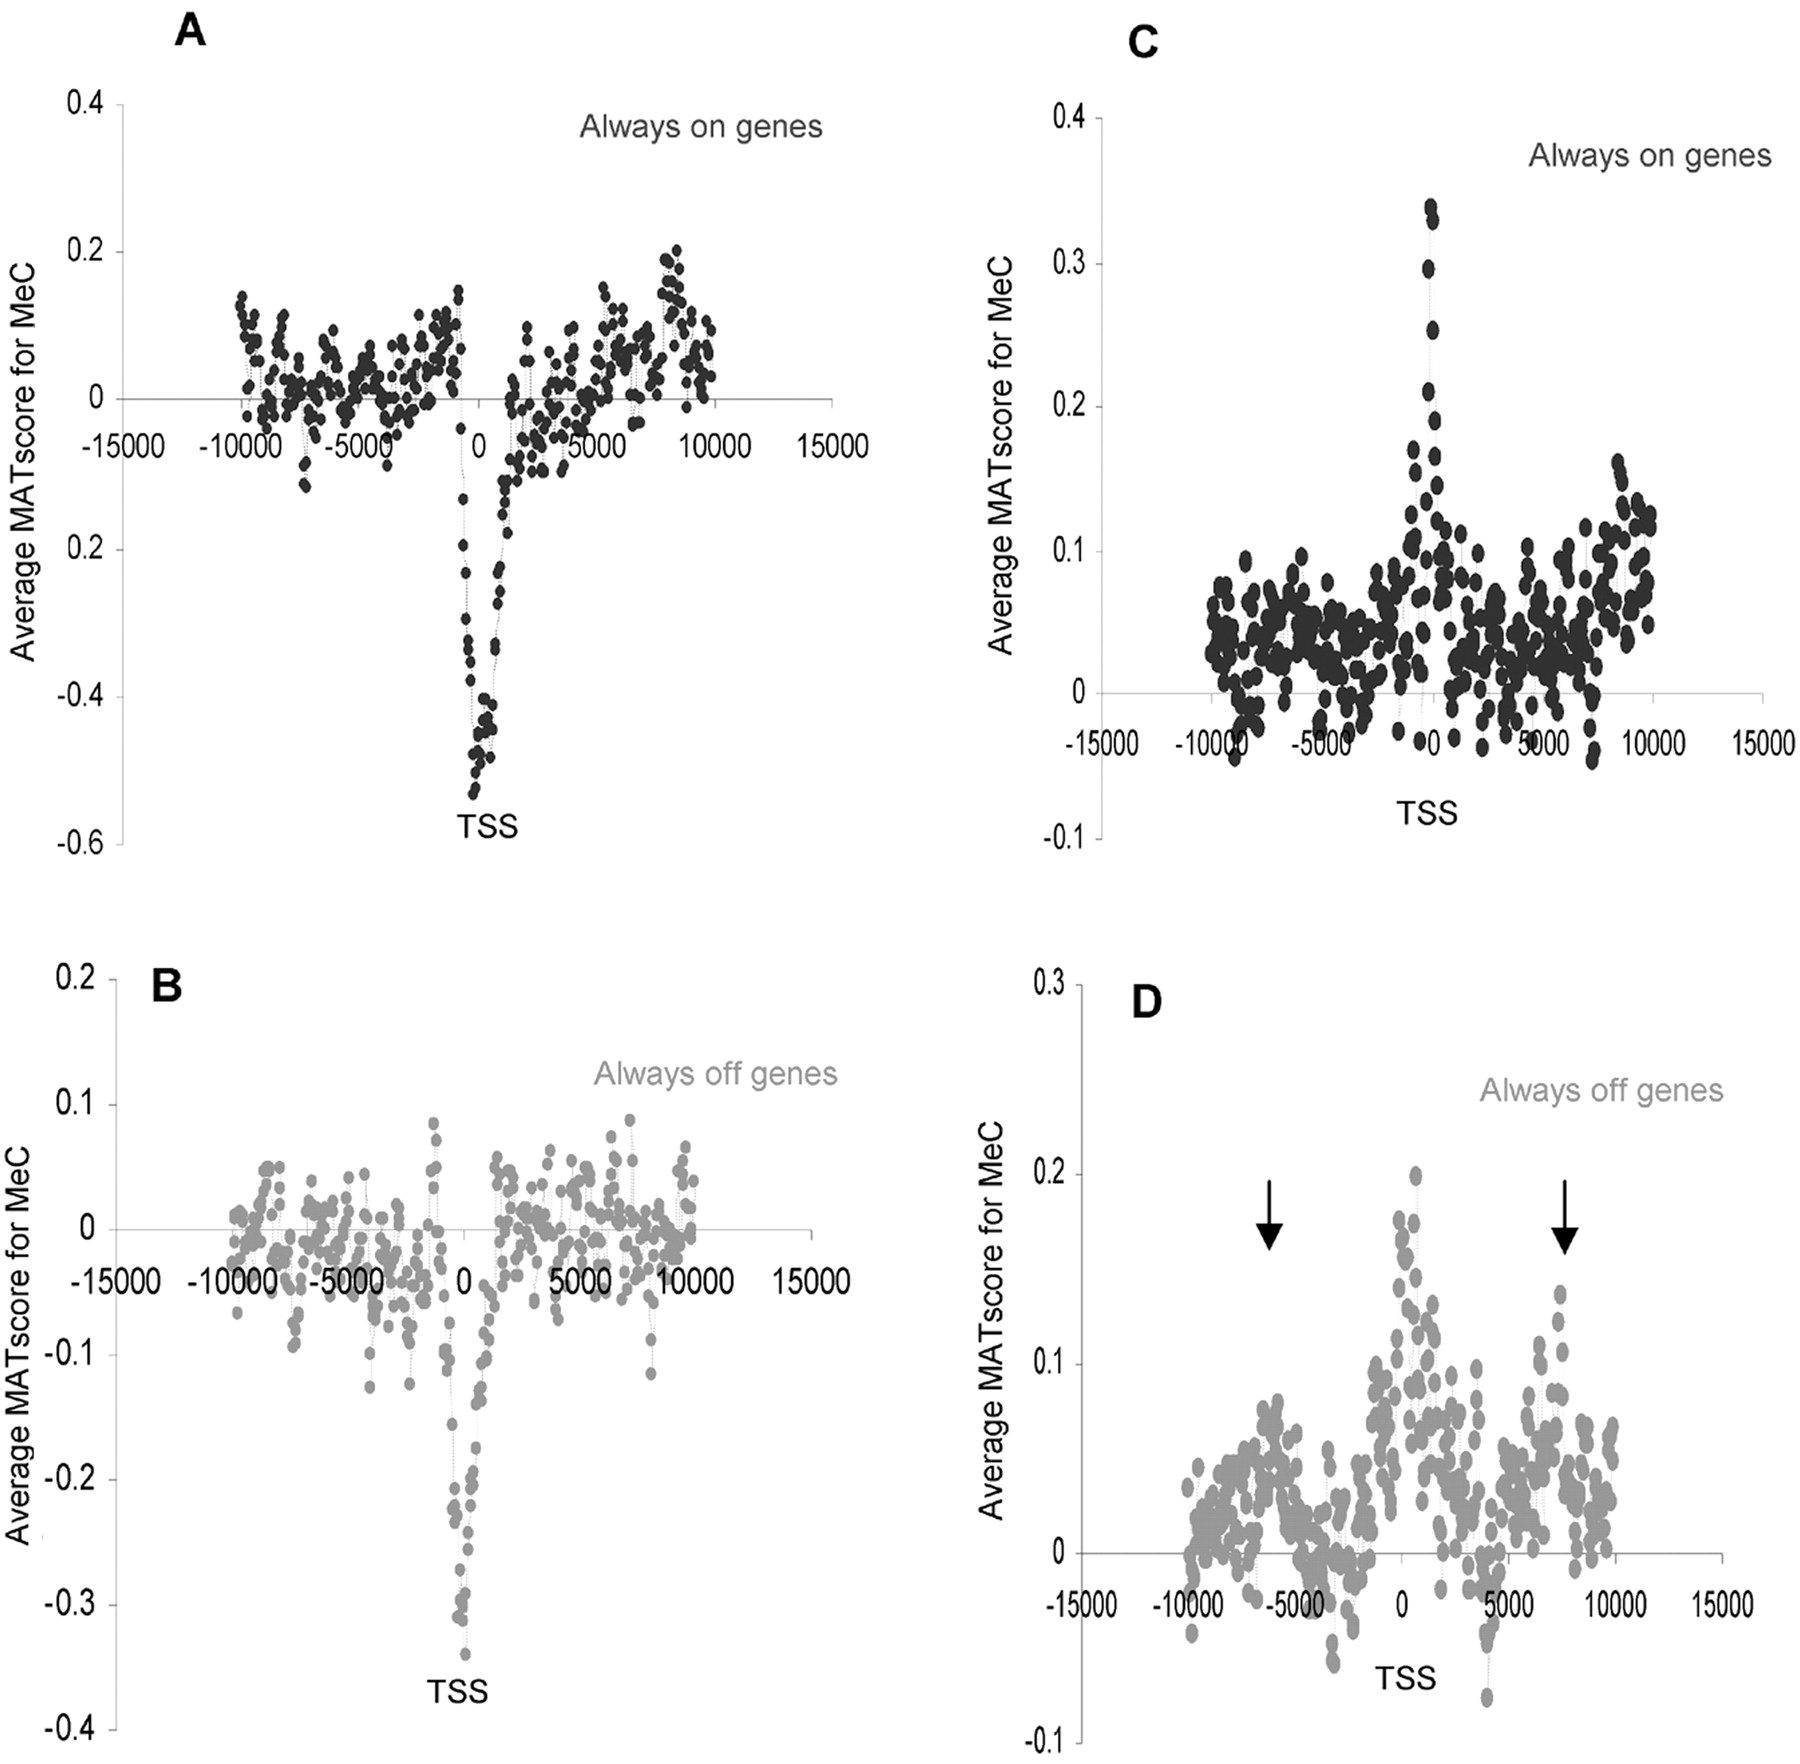
Figure 5.
Cytosine methylation status of genes according to their expression profiles. (A,B) Average MAT scores (y-axis) of meC in sonicated DNA across a 20-kb region centered on the TSS (x-axis) for “always on” (black line) and “always off” (gray line) chr 1 genes. (C,D) As for A and B, but for nucleosomal DNA.


