
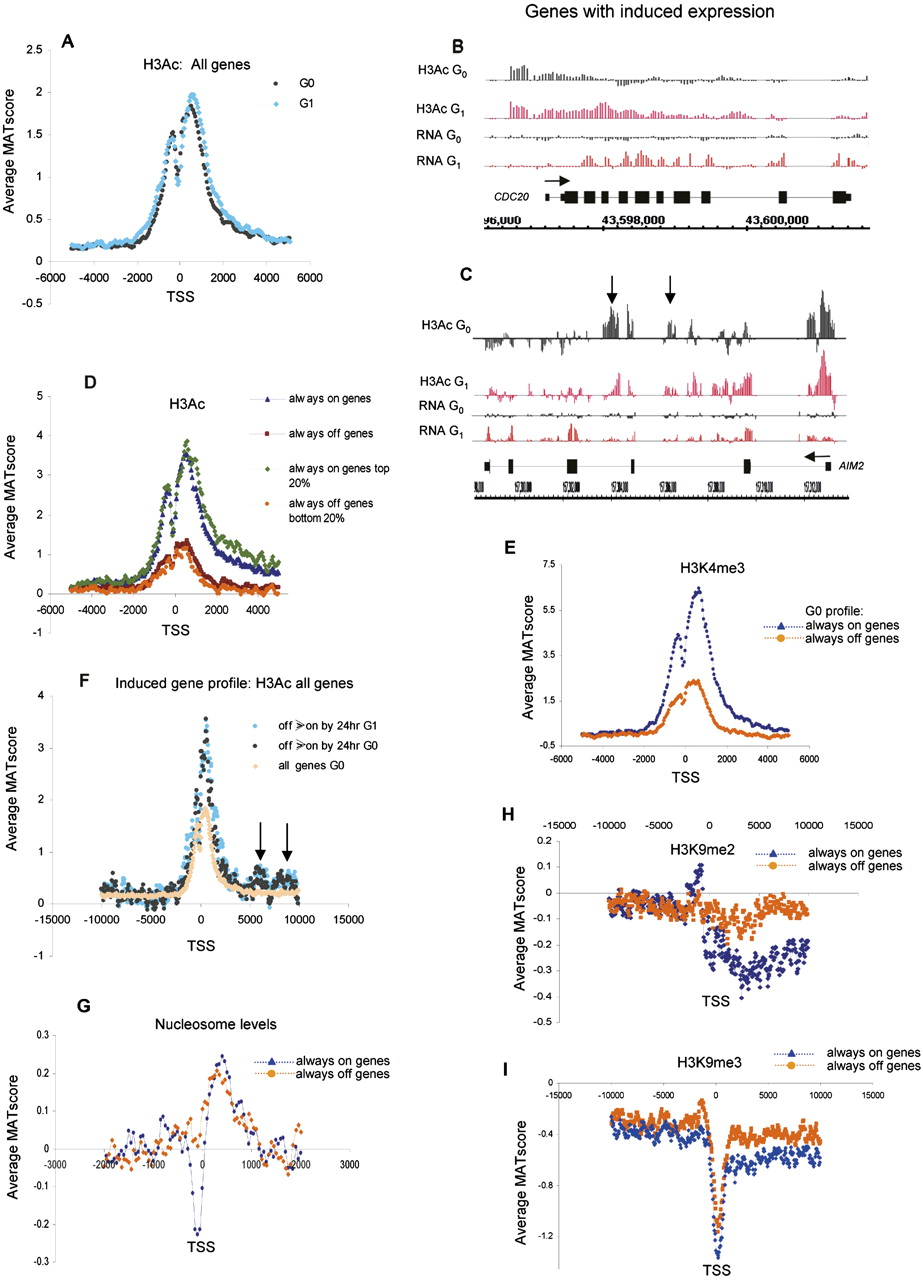
Epigenetic state and nucleosome positioning in G0 and G1 for active vs. inactive genes. (A) Average MAT score (y-axis) for H3Ac across a 10-kb region relative to the TSS (x-axis) for 1935 chr 1 genes in quiescent T lymphocytes (G0; black line) and after stimulation for 72 h with PMA/ionomycin (G1; blue line). (B,C) H3Ac modification of genes with induced expression in quiescent (G0; black bars) and stimulated cells (G1; red bars). Although both AIM2 (cell cycle and tumorigenesis control regulator) and CDC20 (anaphase protein complex co-factor) become induced upon G0→G1 progression, H3Ac distribution changes only for CDC20. (Vertical arrows) Examples of downstream H3Ac peaks in introns 2 and 3 of the induced AIM gene. (D) Average MAT score for H3Ac in quiescent T cells (G0) plotted according to expression. (Blue) Average values of active genes (“always on”), (brown) inactive genes (“always off”), (green) top 20% most active genes, (orange) bottom 20% most inactive genes. (E) Average relative enrichment of H3K4me3 for “always on” (blue line) and “always off” (orange line) genes of chr 1. (F) Average MAT score for H3Ac for genes that become induced by 24 h post PMA/ionomycin stimulation. Analyses were carried out on quiescent (black line) and PMA/ionomycin-stimulated T cells (blue line). Enrichment peaks 5–10 kb downstream of the TSS are present only in induced genes (arrows). (Orange) Pattern for all 1935 chr 1 genes in G0. (G) Average relative nucleosome levels (MAT score) aligned to the TSS for “always on” (blue line) vs. “always off” (orange) genes on chr 1. Analyses were carried out on quiescent T cells. (H,I) Average MAT score for H3K9me2 (H) and H3K9me3 (I) aligned to the TSS for all “always on” (blue line) and “always off” (orange line) genes of chr 1. Analyses were carried out on quiescent T cells.


