
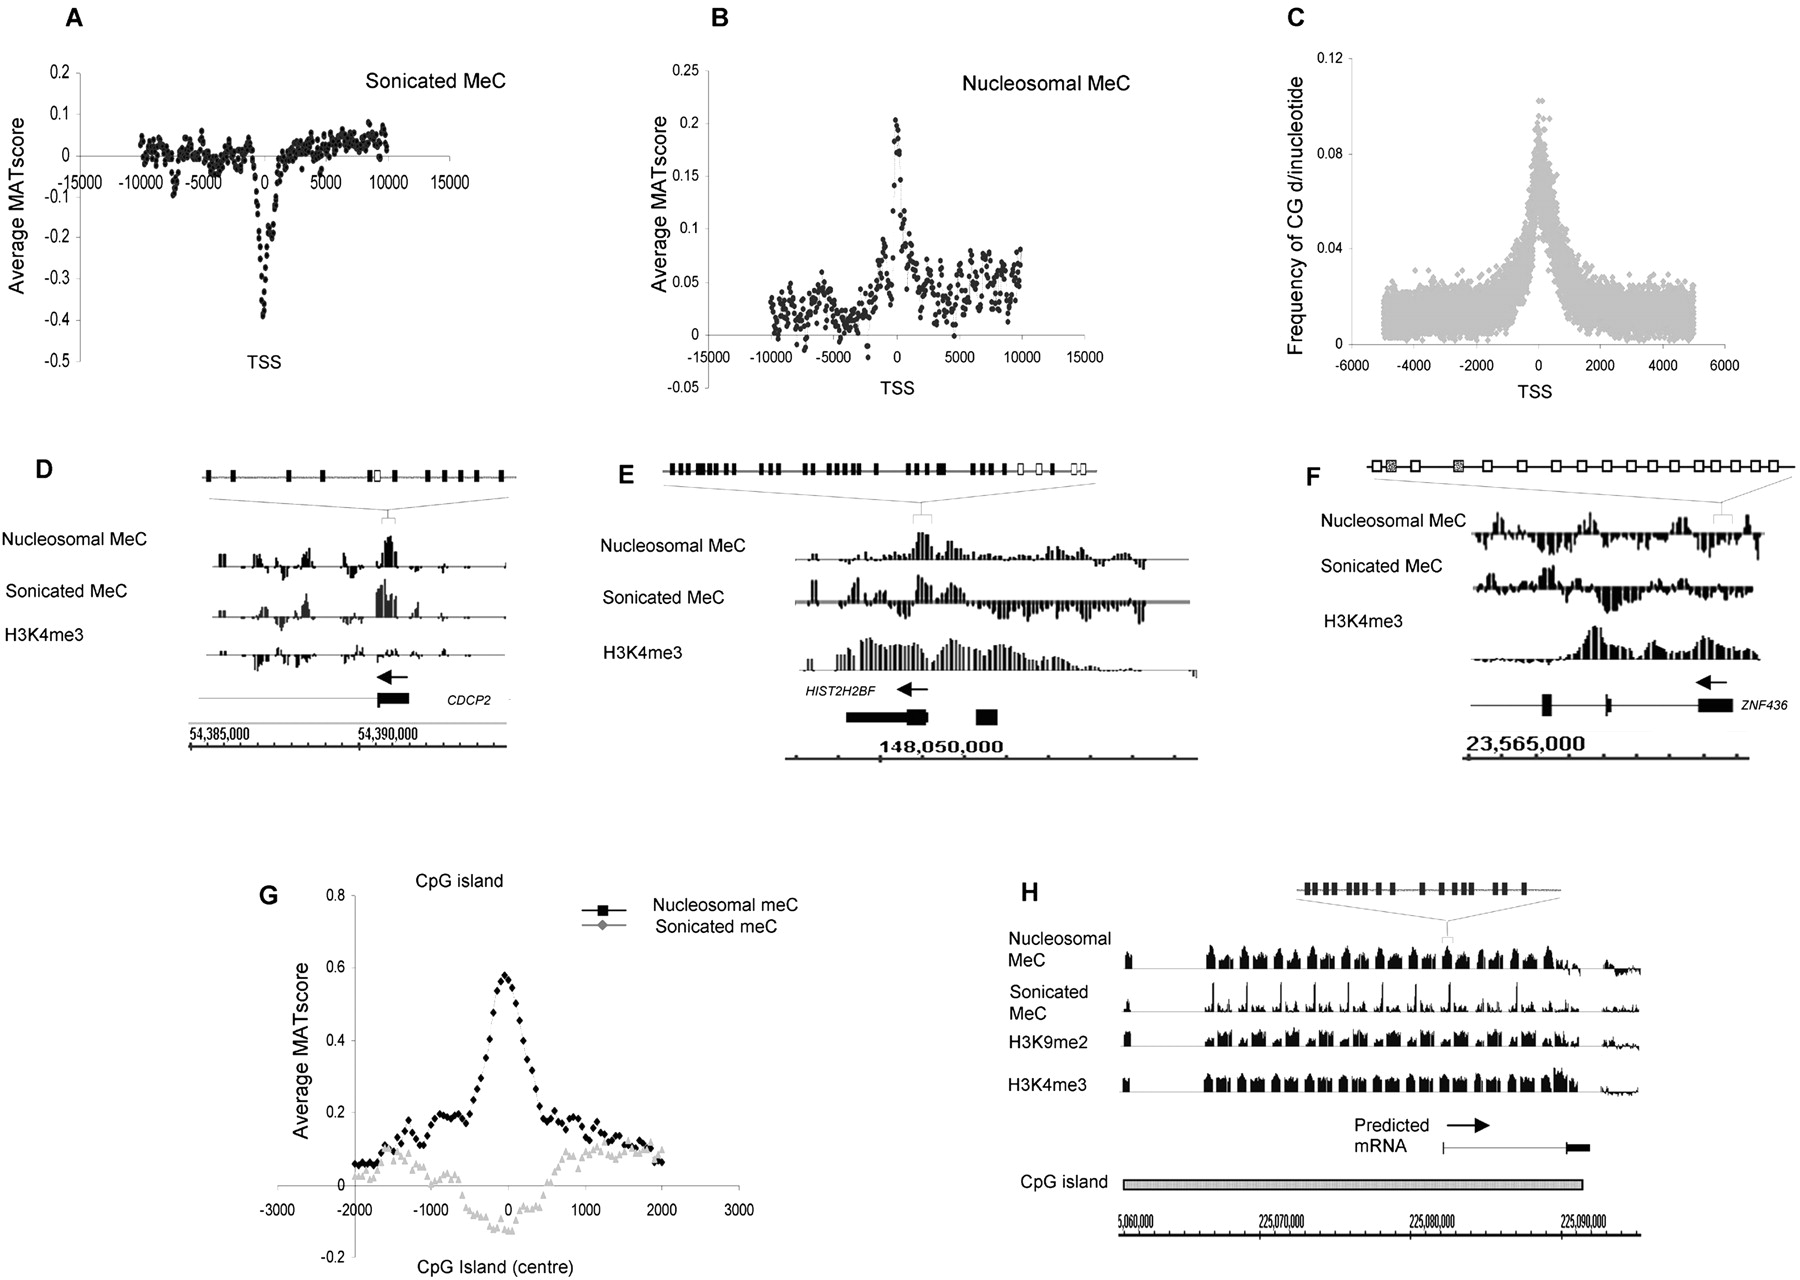
Cytosine methylation in quiescent T cells. (A,B) Average MAT score for meC in randomly sonicated DNA (A) and nucleosomal DNA (B) (y-axis) across a 20-kb region centered on the TSS (x-axis), corresponding to 1935 chr 1 genes. (C) Frequency of the CG dinucleotide (y-axis) relative to the TSS for 615 sense-strand genes. (D–F) Relative enrichment (MAT score) of meC in sonicated and nucleosomal DNA samples, as well as H3K4me3 for the genes CDCP2, HIST2H2BF, and ZNF436. The presence of DNA methylation at these loci was verified by bisulfite genomic sequencing. (Black boxes) Methylated CpG; (white boxes) unmethylated CpG; (gray boxes) low level CpG methylation (<15%). (G) Average MAT score for nucleosomal meC for 2463 CpG islands on chr 1 (black line) and for meC in randomly sonicated DNA (gray line) aligned to the center of each CpG island. (H) An example of a putative CpG island on chr 1 (shaded box) with high levels of meC and H3K9me2. The presence of methylation at the peaks identified was verified by bisulfite genomic sequencing. (Black boxes) Methylated CpG; (white boxes) unmethylated CpG.


