
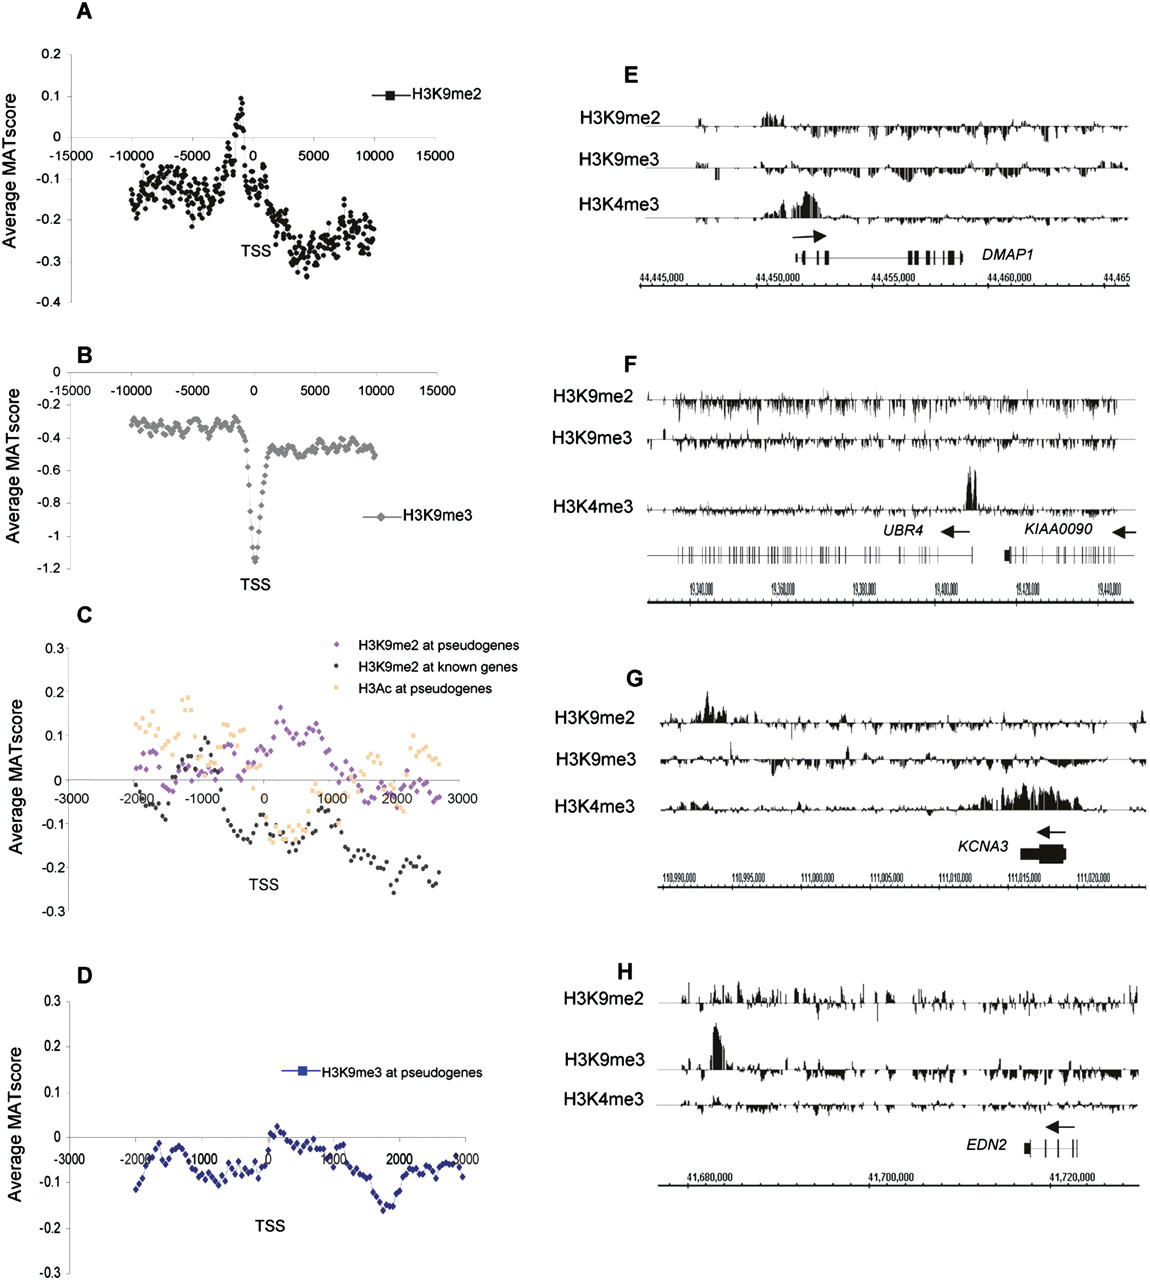
H3K9me2 and H3K9me3 patterns in quiescent T cells. (A,B) Average MAT score for the repressive histone marks H3K9me2 (A) and H3K9me3 (B) (y-axis) across a 20-kb region centered on the TSS of 1935 chr 1 genes (x-axis). (C) Average MAT score for the H3K9me2 modification in all known and predicted pseudogenes (pink line; 2229 loci) and known protein-encoding genes (black line) on chr 1. (Orange) H3Ac enrichment for the same group of pseudogenes. (D) Average MAT score for H3K9me3 modification in all known and predicted chr 1 pseudogenes (blue line; 2229 loci). (E–H) Examples of relative enrichment of H3K9me2, HeK9me3, and H3K4me3 modifications for the genes DMAP1 (E), UBR4 and KIAA0090 (F), KCNA3 (G), and EDN2 (H). Peaks of enrichment for H3K9me2 and H3K4me3 modifications around the TSS are seen for DMAP1. For UBR4 and KIAA0090, under-representation of the H3K9me2 and HeK9me3 marks occur throughout the gene body. Under-representation of H3K9me2 and contrasting high levels of H3K4me3 occur throughout the body of KCNA3. (G,H) An example of an intergenic H3K9me2 peak 25 kb downstream of KCNA3 (G) and an intergenic H3K9me3 peak 20 kb downstream of EDN2 (H).


