
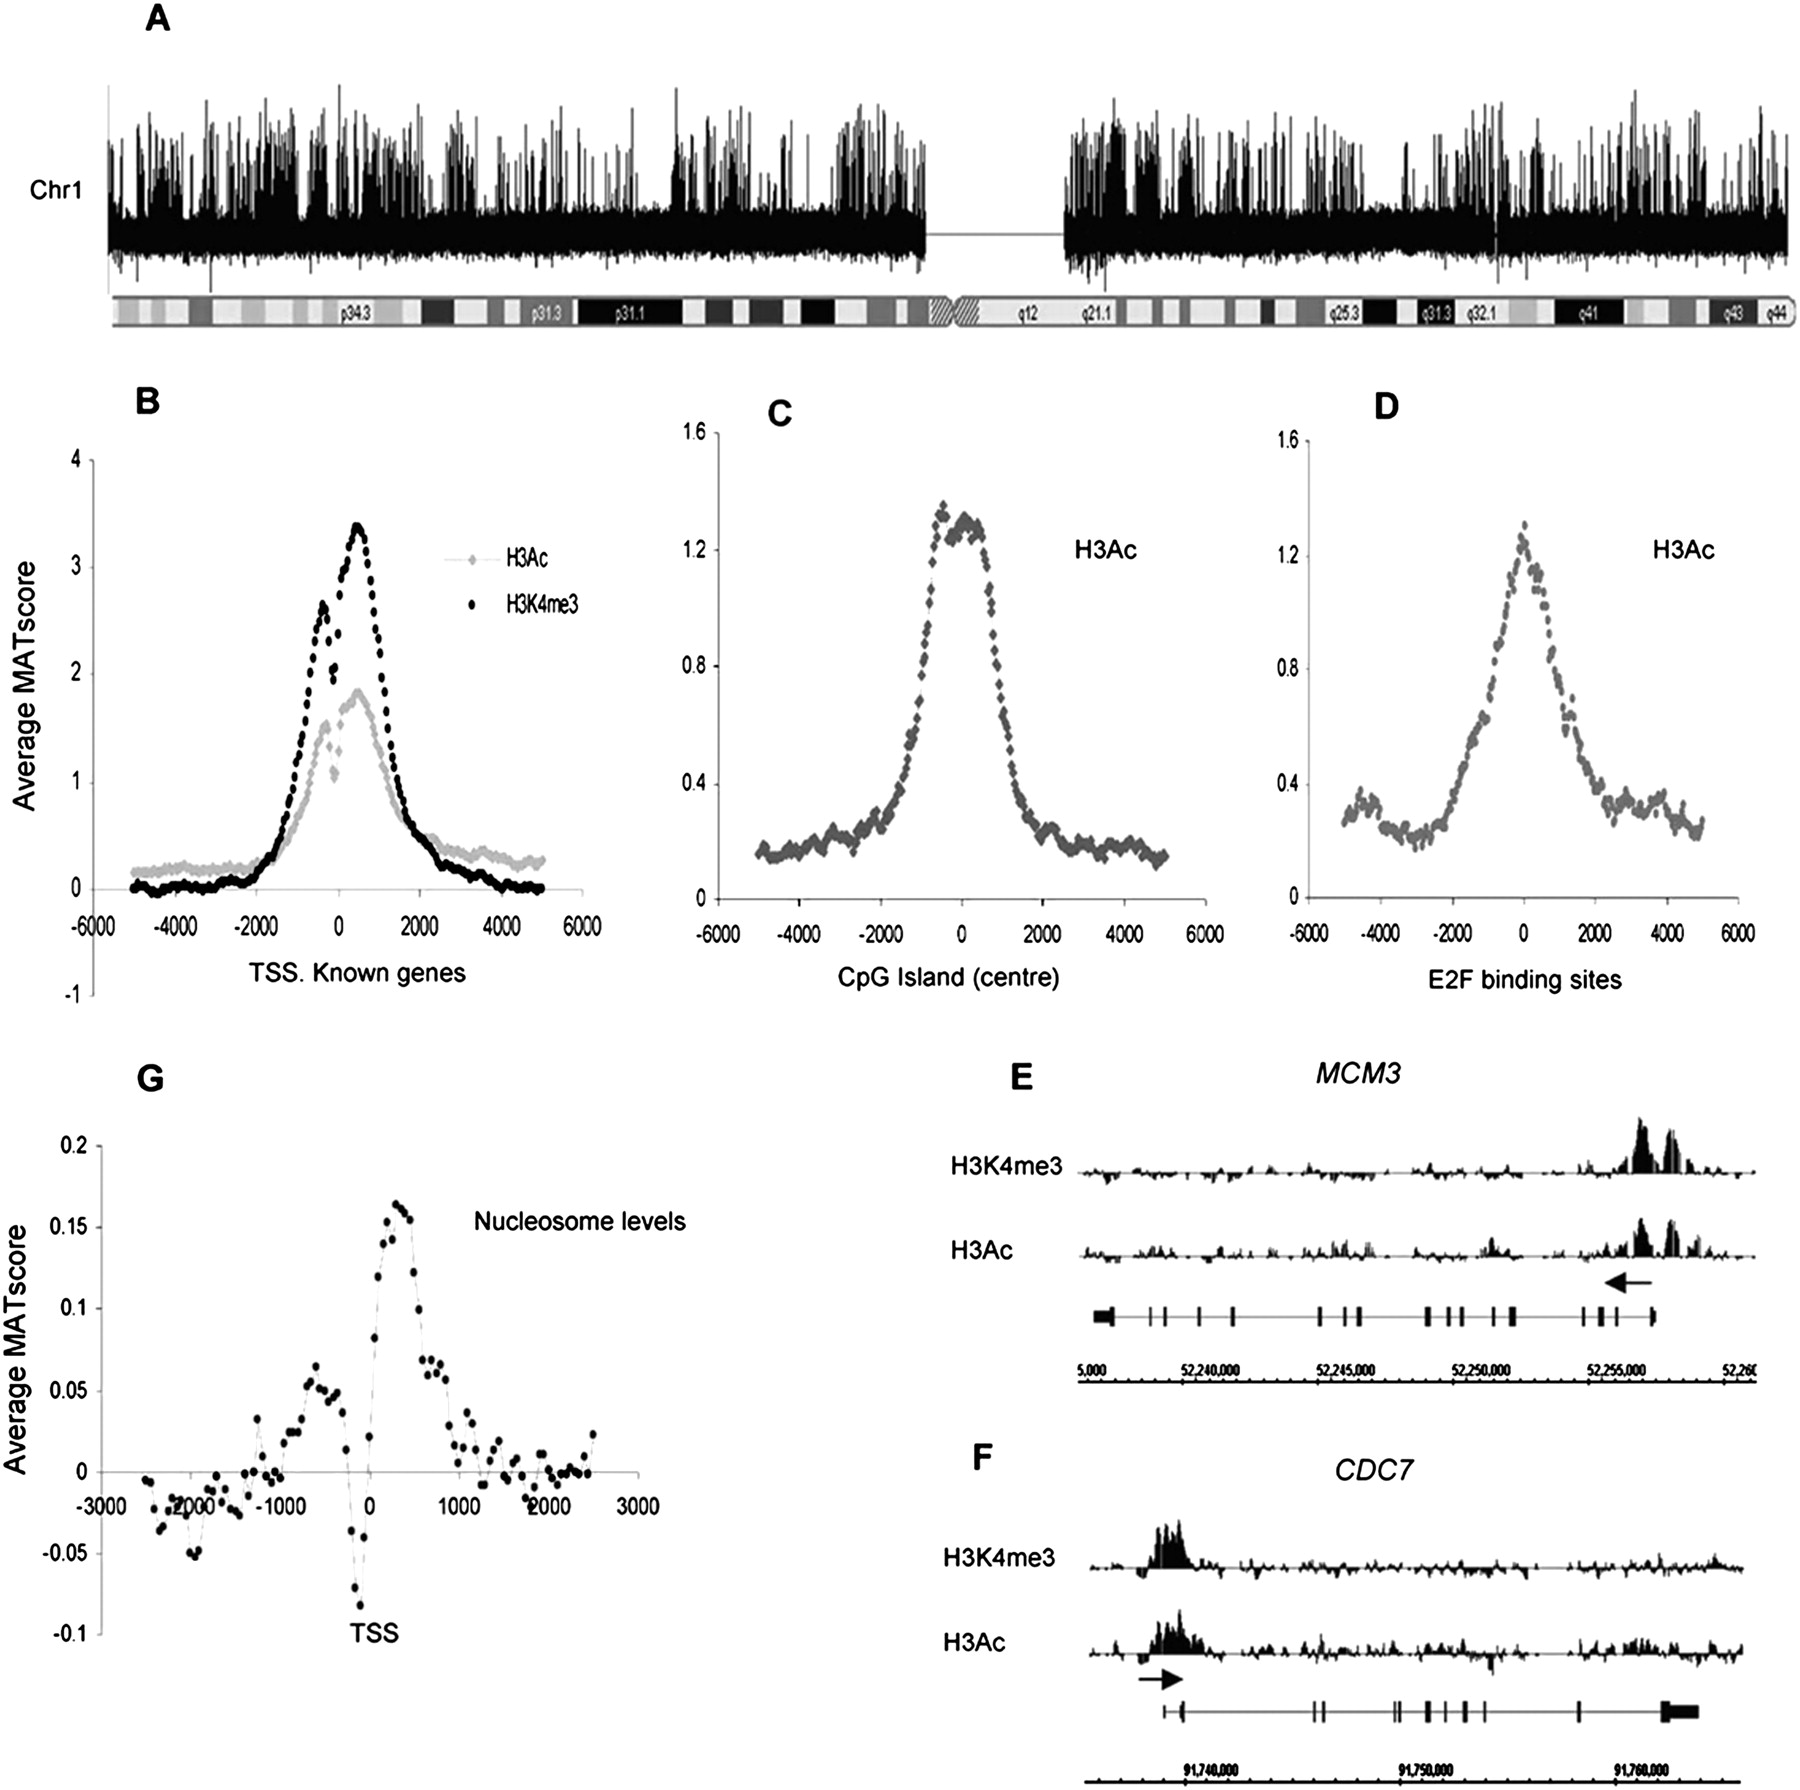
Activated histone marks and nucleosome positioning in quiescent T cells. (A) Relative enrichment of H3K4me3 across chr 1 following chromatin immunoprecipitation experiments. All analyses of microarray signal intensity were performed using the MAT program (output: log signal values). (B) Average relative enrichment based on average MAT scores (y-axis) of active histone marks H3Ac (H3K9/14Ac) and H3K4me3 across a 10-kb region centered on the TSS (x-axis) for 2104 unique TSSs, corresponding to 1935 known chr 1 genes. Values were binned at 50-bp intervals for all analyses unless stated otherwise. (C) Average MAT score for H3Ac for 2463 CpG islands on chr 1 aligned to the center of each CpG island. (D) Average MAT score for H3Ac centered on a set of 1000 E2F binding sites on chr 1 identified by The ENCODE Project Consortium (2007). (E,F) Relative enrichment (MAT score) of H3Ac and H3K4me3 for the genes encoding DNA replication and cell cycle proteins MCM3 and CDC7. (x-axis) Genomic structure and relative size of these genes, (y-axis) normalized signal values of the modifications present. (Horizontal arrow) Direction of transcription. (G) Average relative nucleosome levels at the TSS for 1935 chr 1 genes.


